Raven Tools is an SEO, marketing, and auditing tool.
It’s cloud-based and is designed to be used by agencies, media companies, in-house marketers, and freelancers.
It’s a useful tool but it can be a little tricky to get used to at first.
That’s why I’ve put together this comprehensive guide.
I’ll show you how to use all of Raven Tools’ best features and take a look at how it stacks up against some of its competitors.
Ready to learn everything you need to know about Raven Tools?
Good!
Let’s get started.
What Is Raven Tools?
So, before I start my deep dive into Raven Tools’ many features let’s first take a quick look at what it actually is.
Raven Tools was founded in 2004 and it was acquired by TapClicks in 2017.
It includes features for:
- Keyword research and analysis
- Rank tracking
- Campaign analytics
- Compiling marketing data
- Link building
- Competitor research
- Communication
- Managing your inbound and outbound reporting
- Managing content
- Ordering, optimizing, and publishing content directly from the tool
It’s a useful online marketing reporting tool that can save you LOADS of time.
Plus, it offers plenty of integrations with email accounts, social media accounts, and ad campaigns for comprehensive data analysis.
As far as SEO tools go, it’s pretty affordable and it’s relatively easy to get used to.
Raven Tools Features
Dashboard
The Raven Tools dashboard is nice and simple.
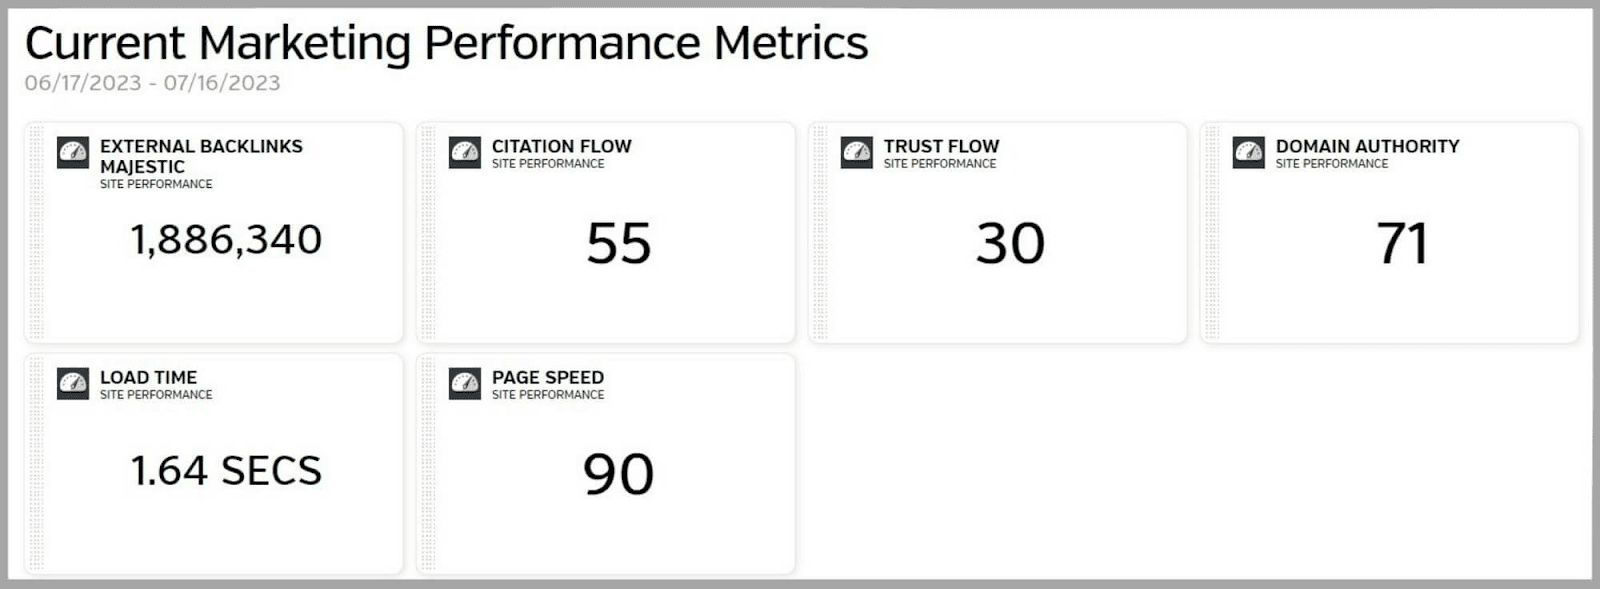
It gives you a quick overview of some of your site’s performance metrics:
- External Backlinks
- Citation Flow
- Trust Flow
- Domain Authority
- Load Time
- Page Speed
When I scroll down, I can see a graph of my total links since 2011.
Each line on the graph is color-coded to represent the trend of a different year.

This allows me to quickly see how many backlinks I’ve gained or lost over the years.
At the bottom of the page, there’s a summary of “Identified On-Page SEO Opportunities”.
This highlights:
- Visibility Issues
- Meta Issues
- Content Issues
- Link Issues
- Image Issues
- Semantic Issues
- Desktop Speed Score
- Mobile Speed Score
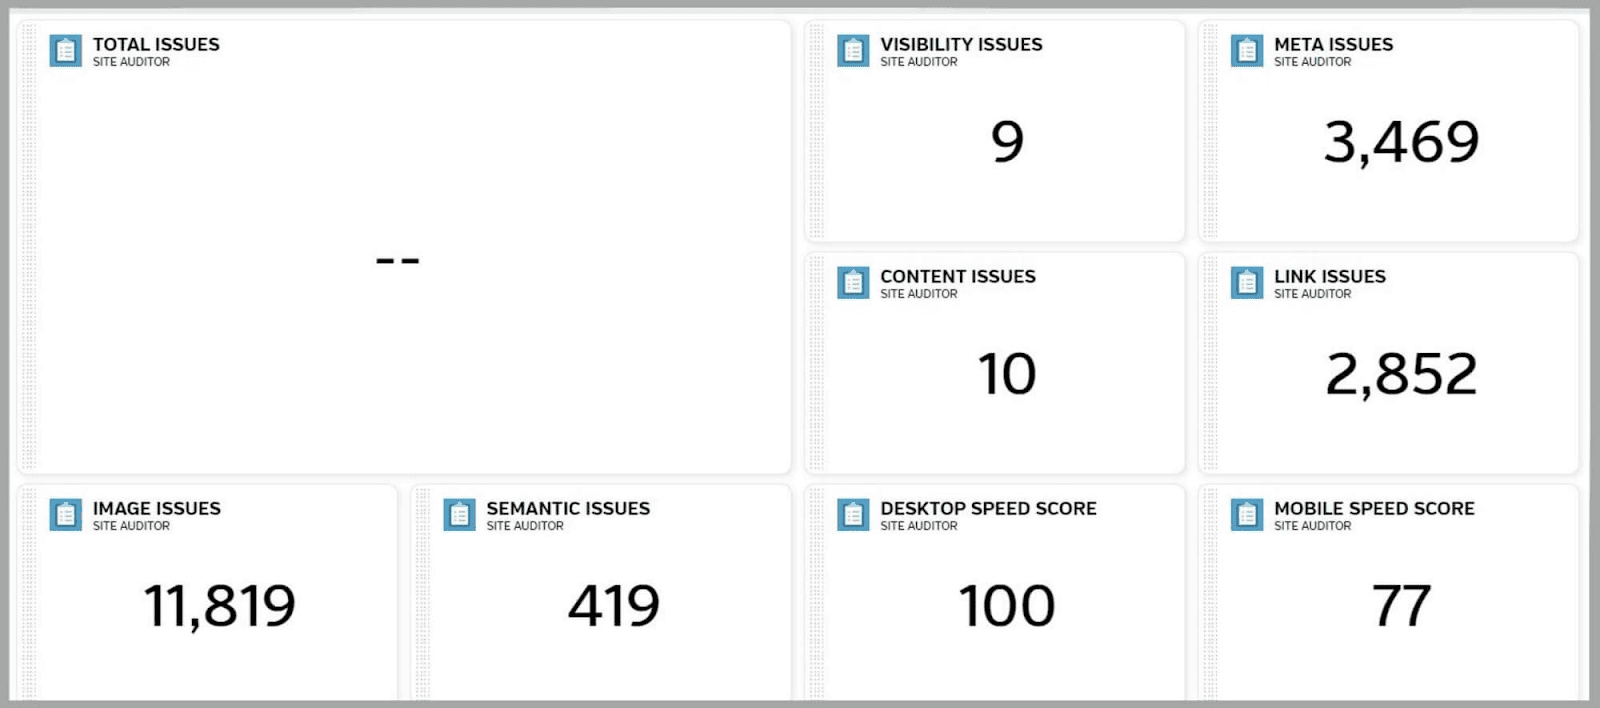
This alerts you to any issues on your site that might be hampering its performance.
If you want to view any of these issues in more detail then you simply click on a specific issue and you’ll be taken to the Site Auditor tool (more on this later).
For example, say you wanted to view the data about “Meta Issues” on your site, you’ll need to click “Connect to Site Auditor” first.
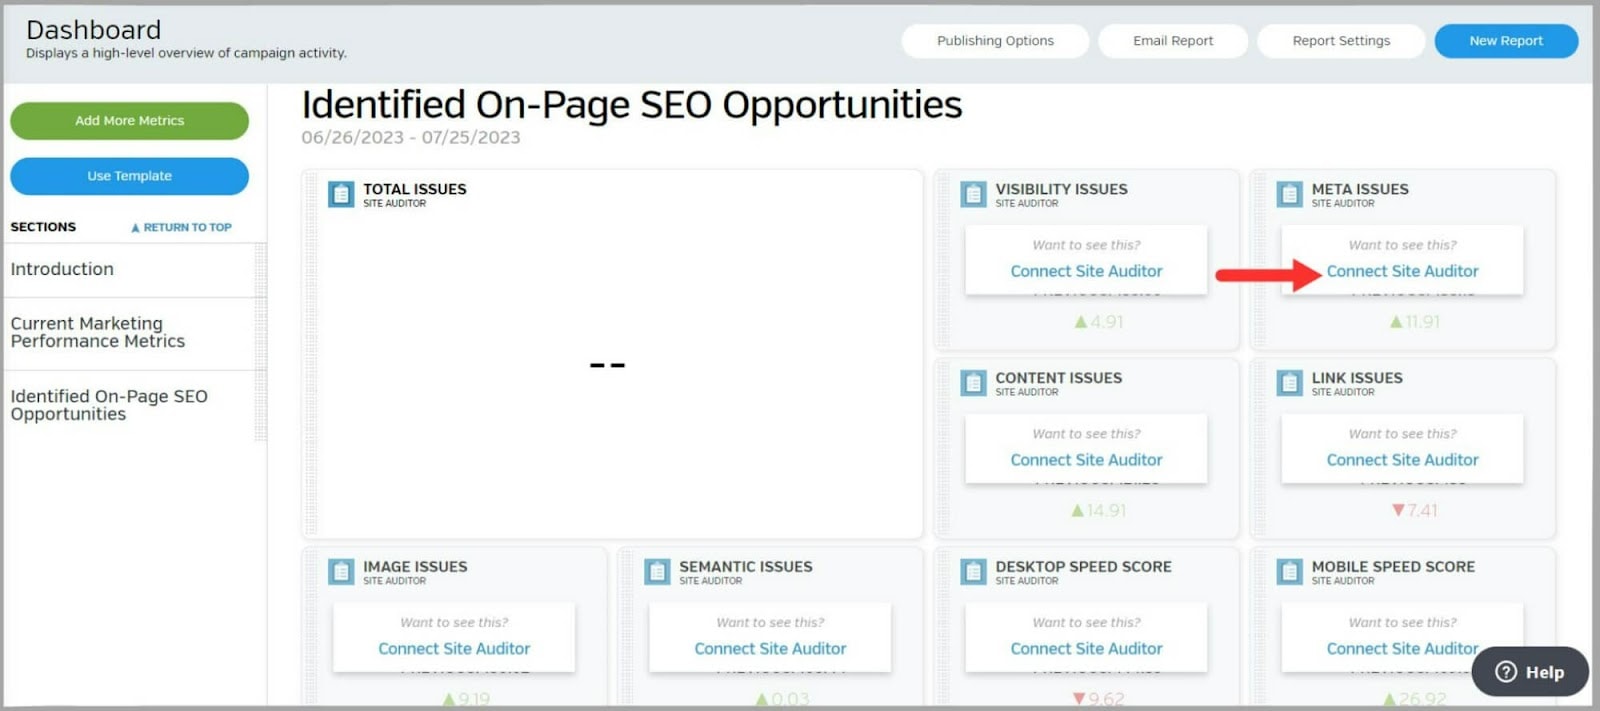
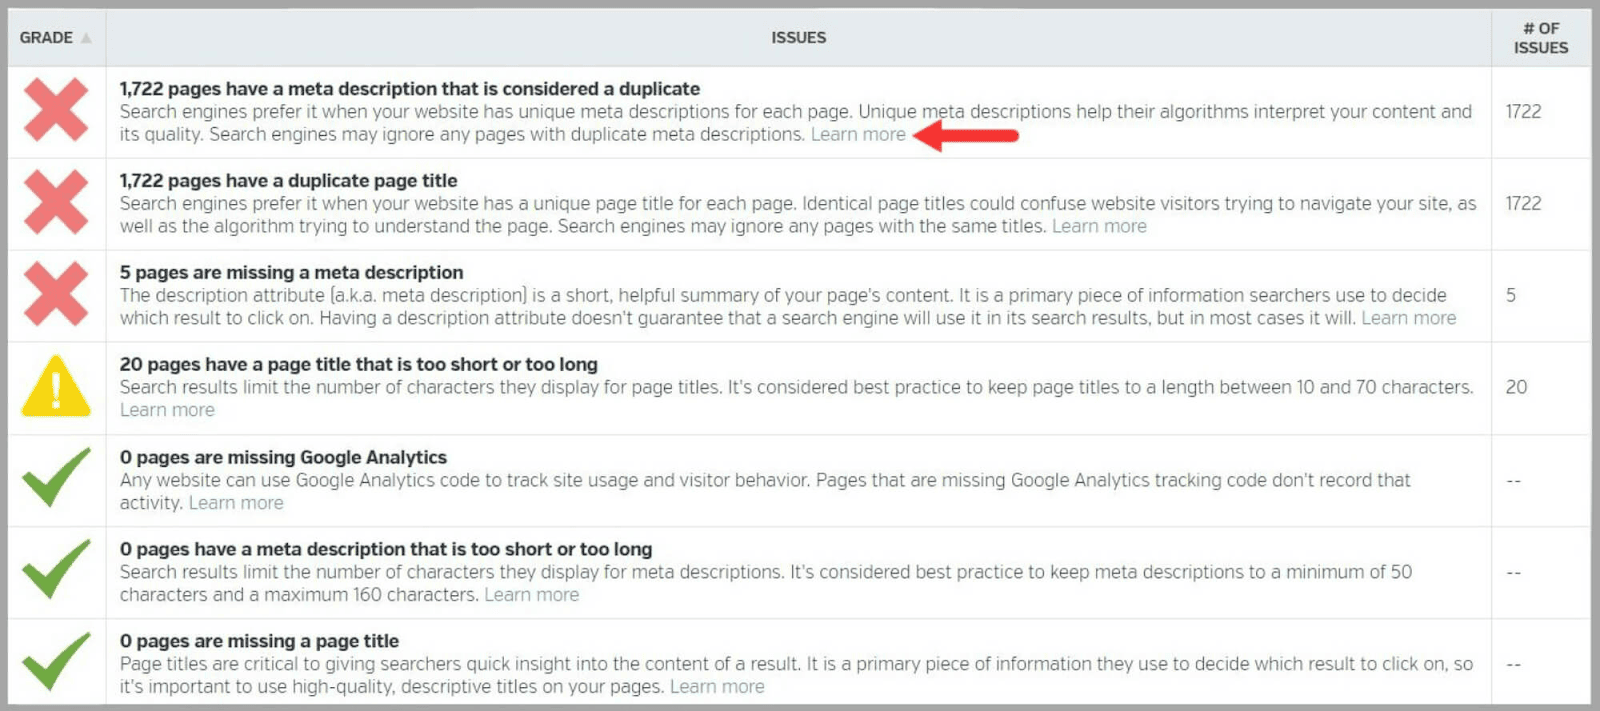
Then, if you scroll to the bottom of the page you’ll see a summary of any “Meta Issues” your site has.
By clicking “Learn More” you’ll be taken to a Google Search Central page that gives you advice on resolving the issue.
On the left side of the page, there’s an option to “Add More Metrics”.
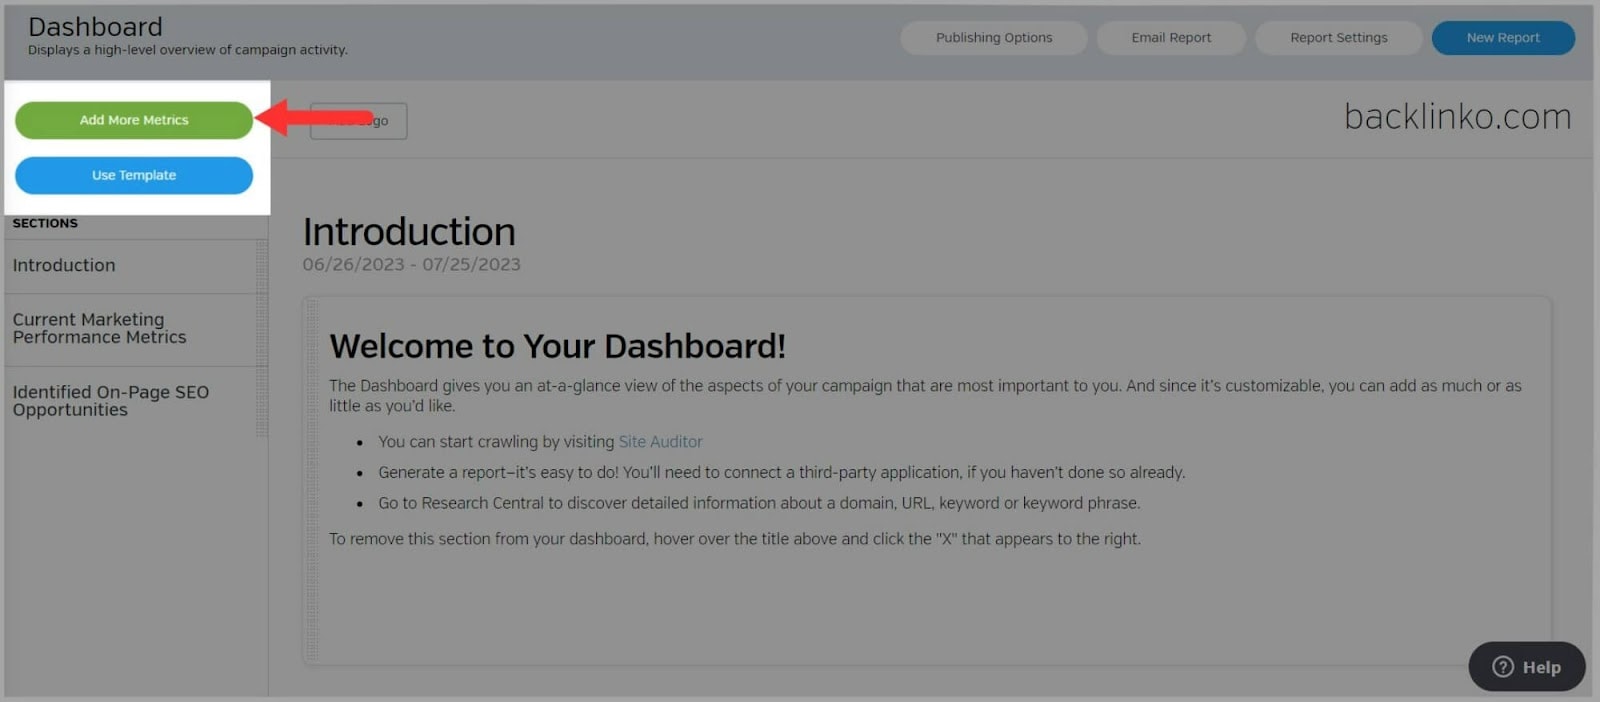
When you click on this, you can choose to add metrics from other platforms to your dashboard, for example, Google Analytics.
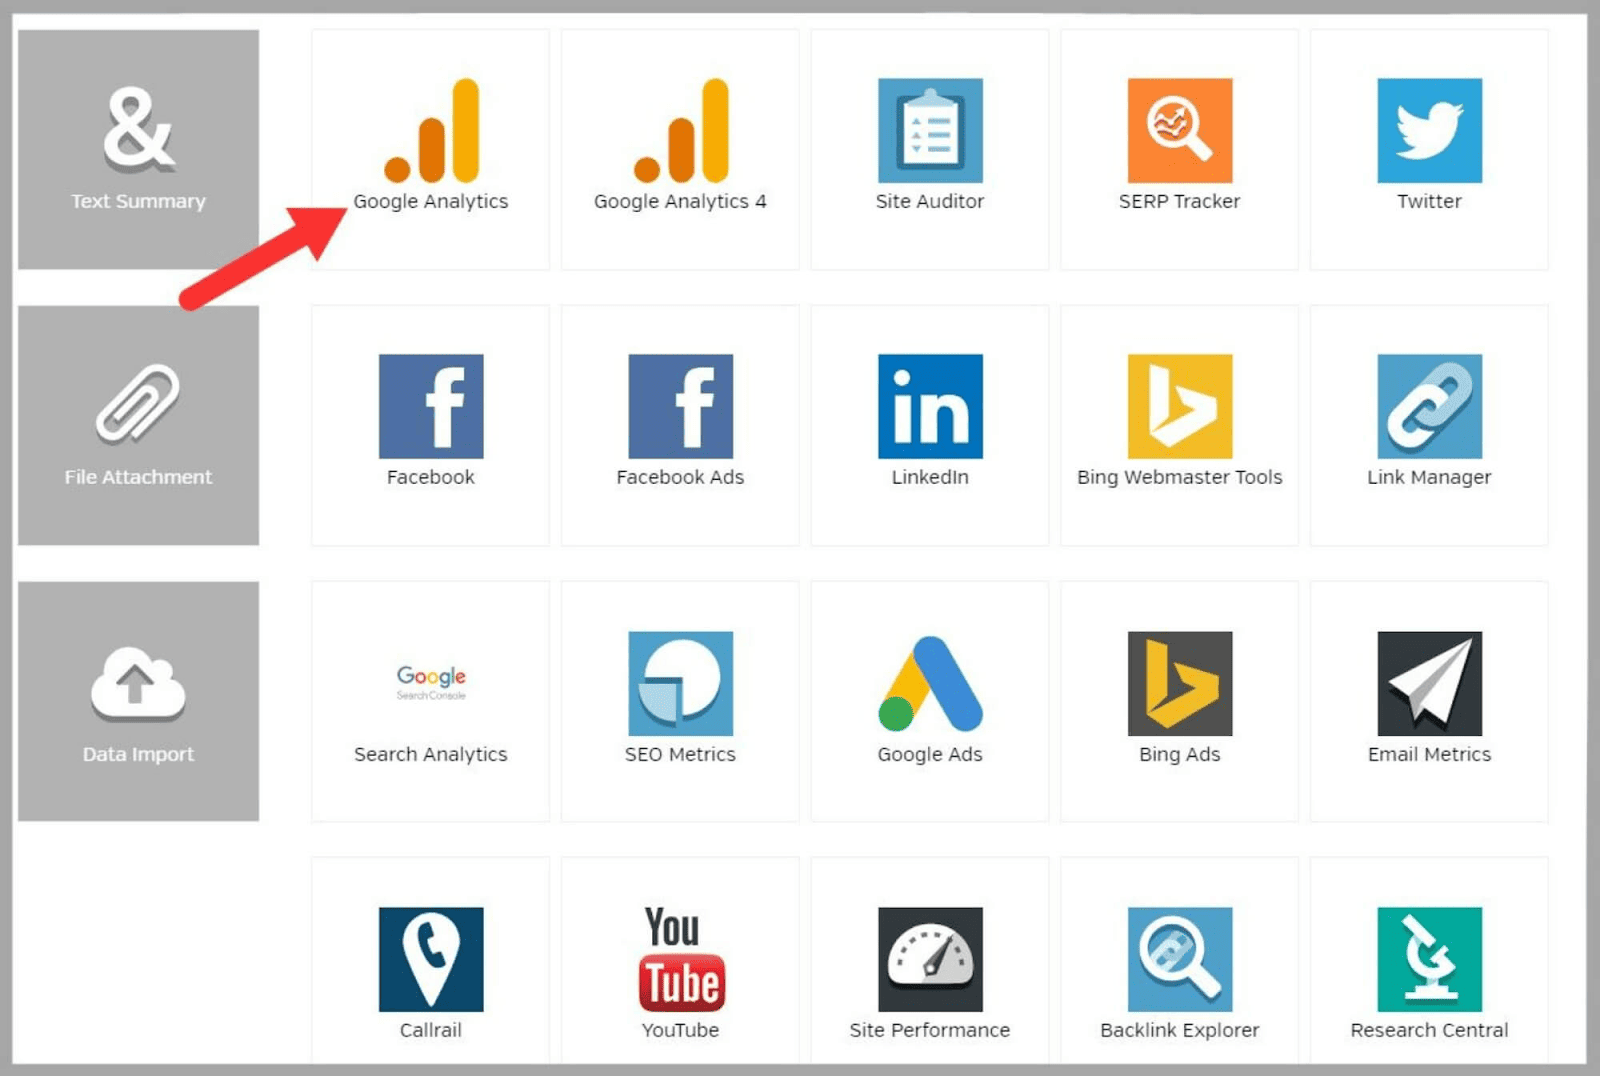
This means you can take a quick glance at all of your Google Analytics metrics in one place.
Sweet.
SEO Research
The SEO Research tool has several features that allow you to audit your site and keep track of your Google Analytics data. Let’s take a look at everything this tool has to offer.
Site Auditor Classic
The Site Auditor Classic lets you perform SEO site audits.
This is the best way to fully analyze your site’s strengths and weaknesses, and identify areas where you need to improve its performance.
You can also use this feature to analyze your competitors’ domains.
Once Raven Tools has audited your site, you’ll see a summary page.
Here, I can see issues on my site broken down into six categories:
- Visibility issues
- Meta issues
- Content issues
- Link issues
- Image issues
- Semantic issues
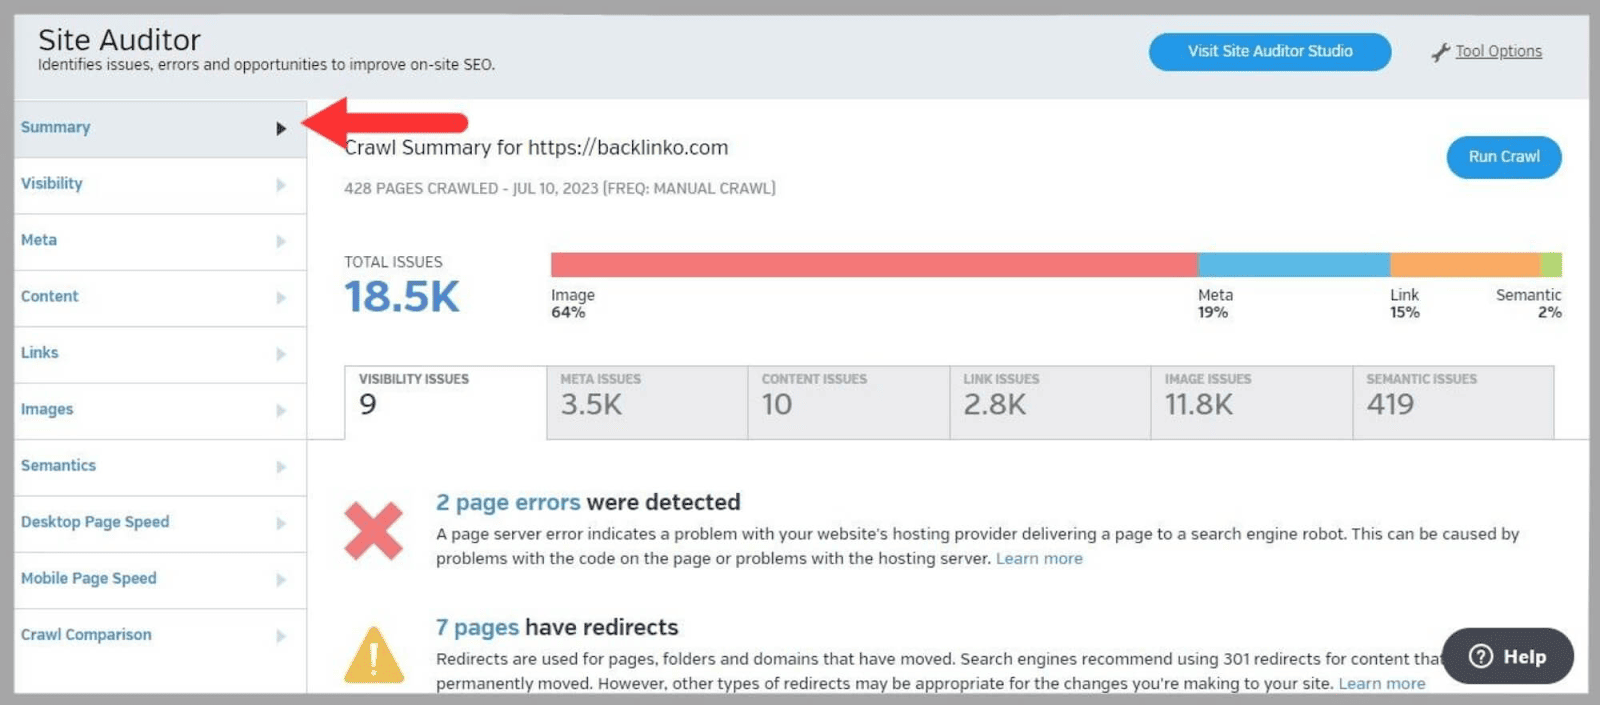
As you can see, the majority of the issues the Site Auditor found appear to be image-related.
By clicking on the “Image Issues” tab I can see what the actual issues are.
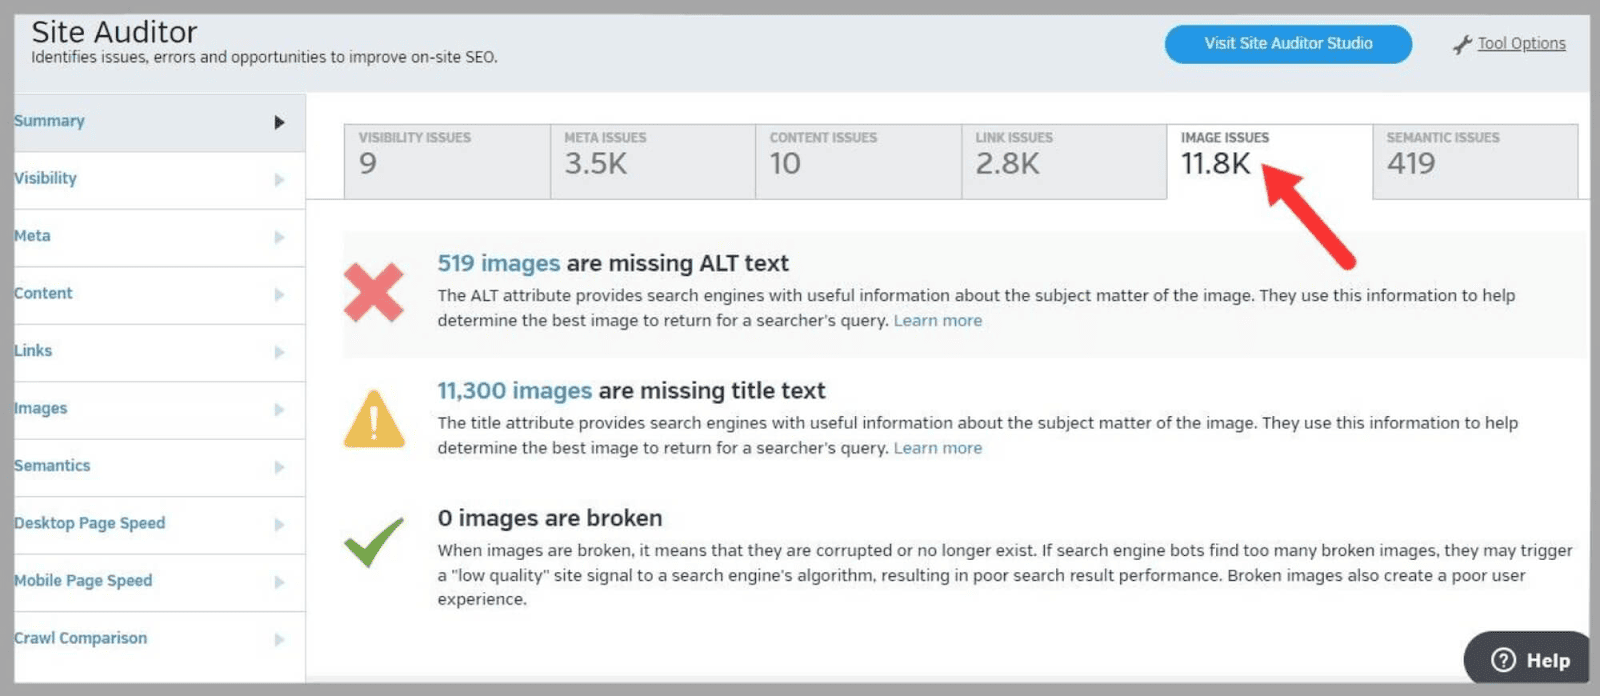
Missing ALT text and title text are clearly the biggest issues, and now that I know this, I can look at addressing these.
On the left-hand side, there are more tabs for you to explore.
These include:
- Visibility: how easily a web page can be found and displayed on the SERPs when a relevant keyword is searched by a user
- Meta: provides information about a page to users and search engines. They usually include metadata such as meta titles and meta descriptions
- Content: the visual, textual, or interactive elements on a page
- Links: hyperlinks that connect a site’s pages to each other or link to or from external sites
- Images: the images, illustrations, and graphics used on a site
- Semantics: relates to the structure and meaning of content on a page. For example, how different elements are organized to communicate certain information to the user
- Desktop Page Speed: how long it takes for a page to load and be fully functional on a desktop computer
- Mobile Page Speed: the same as above but for mobile devices
- Crawl Comparison: involves comparing two or more different pages to see how search engines crawl them. This helps to identify any crawlability issues
So, for example, when I click on “Mobile Page Speed” I get some useful data.
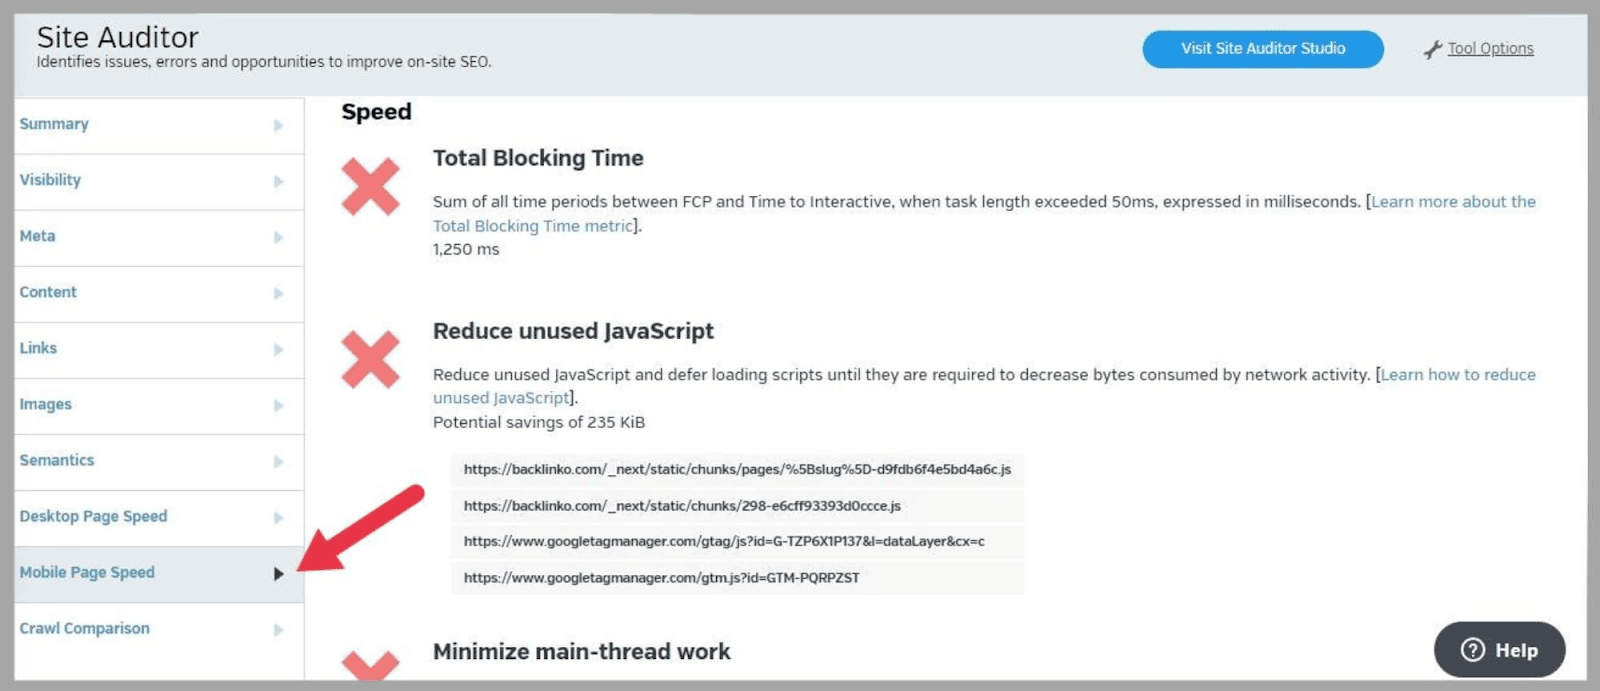
The report showed me that I have an issue with “Total Blocking Time”.
“Total Blocking Time” is the amount of time a browser’s main thread is blocked by long tasks.
This prevents the page from responding to user input.
When this happens, the web page feels sluggish and unresponsive which obviously isn’t great for the user experience (UX).
My “Total Blocking Time” is 1,250 ms.
Google considers anything over 600 ms to be slow. So Raven Tools has identified an area I can work on to improve my site’s UX.
Along with the data, you’ll also get recommendations on how to fix the issues. That’s super useful.
Site Auditor Studio
The Site Auditor Studio is a fairly simple tool that gives you a list of issues with your site and ranks them by importance.
The classifications are “Critical”, “Warning”, and “Needs Attention.”
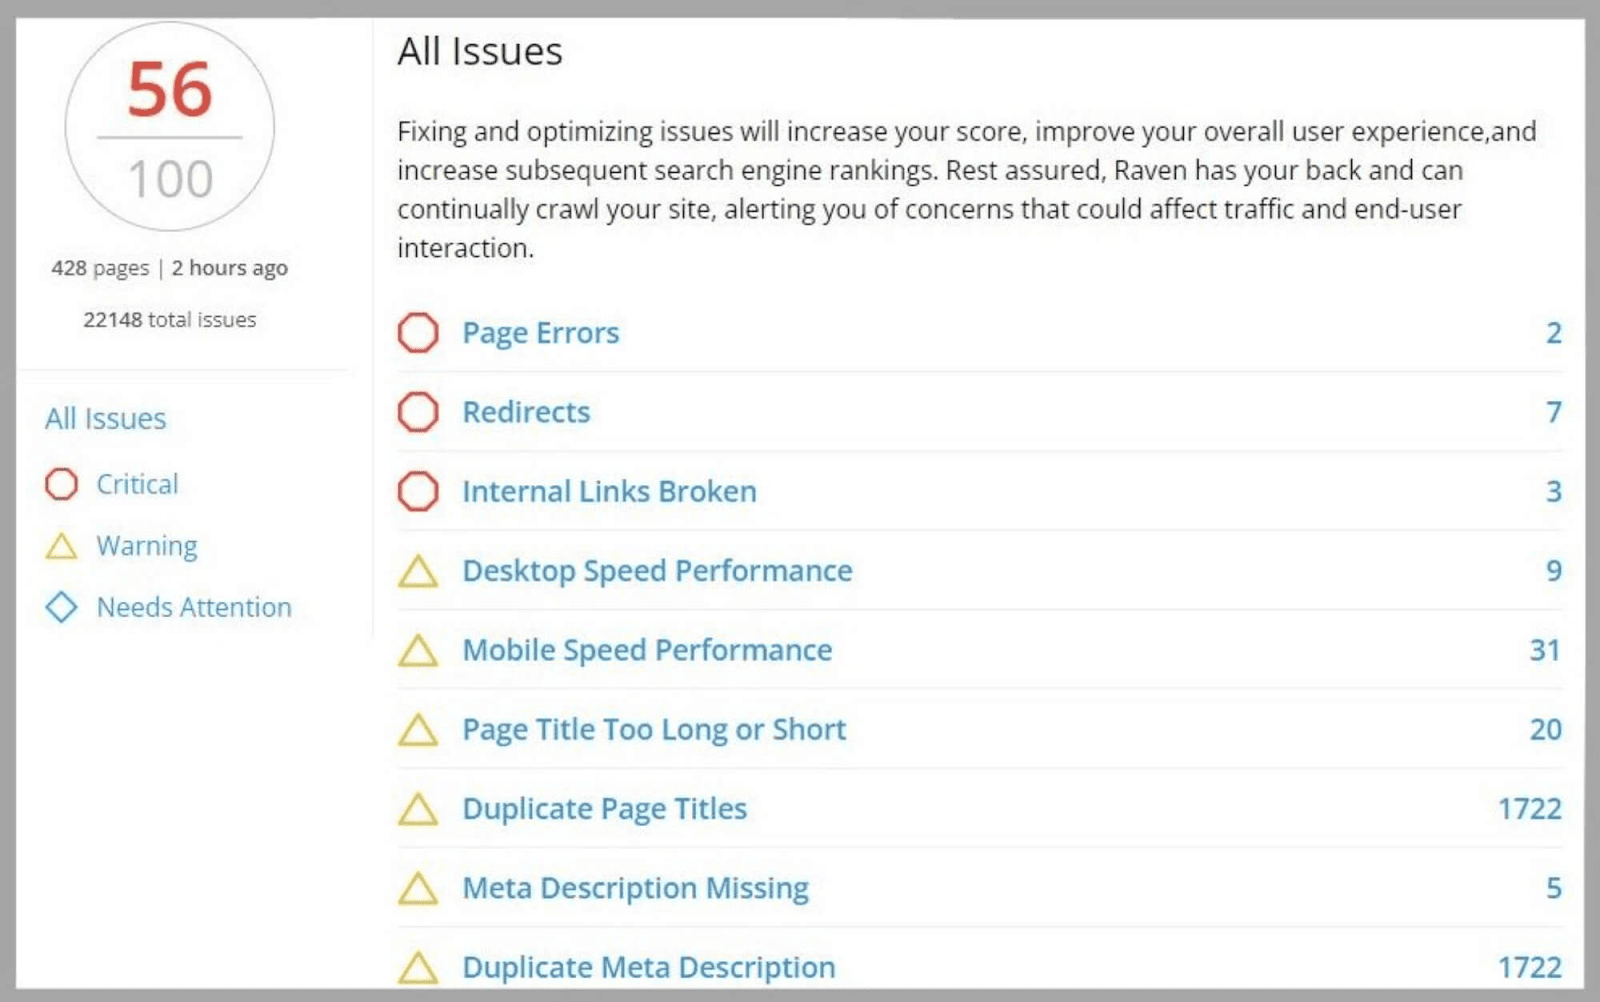
Here, I can see my site score out of 100 and issues relating to “Page Errors”, “Redirects”, and “Internal Broken Links.”
By clicking on the specific issue you’ll get more detailed info.
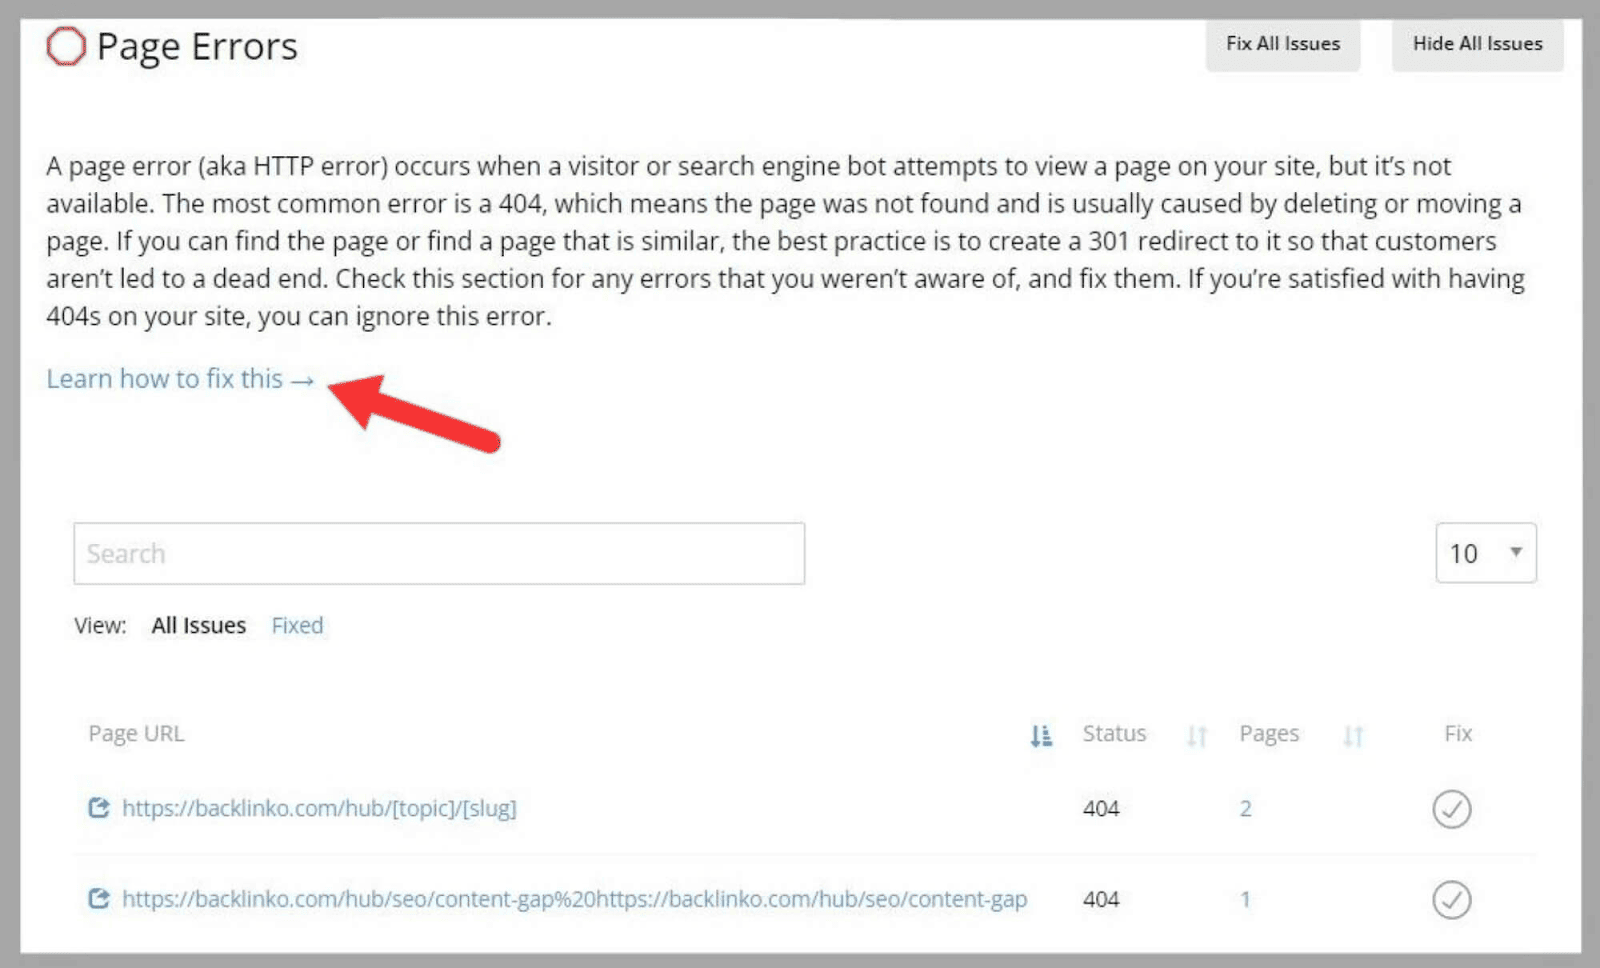
For example, when I click on “Page Errors” I can see the type of error and the page URLs.

As you can see, I have two pages with 404 errors. These errors can occur when the pages no longer exist or have been moved.
Now that Raven Tools has made me aware of this issue I can check out these two pages and try to fix the problem.
If you’re not sure how to fix the problem, you can click on “Learn how to fix this” to be taken to a help page in Google’s Search Console.
Google Analytics
The Google Analytics feature displays all of your Google Analytics data in one place.
The “Overview” section makes it straightforward to view data about your:
- Top Traffic
- Top Referrals
- Top Landing Pages
- Top Social Network Referrals
- Top Events
- Top Campaigns
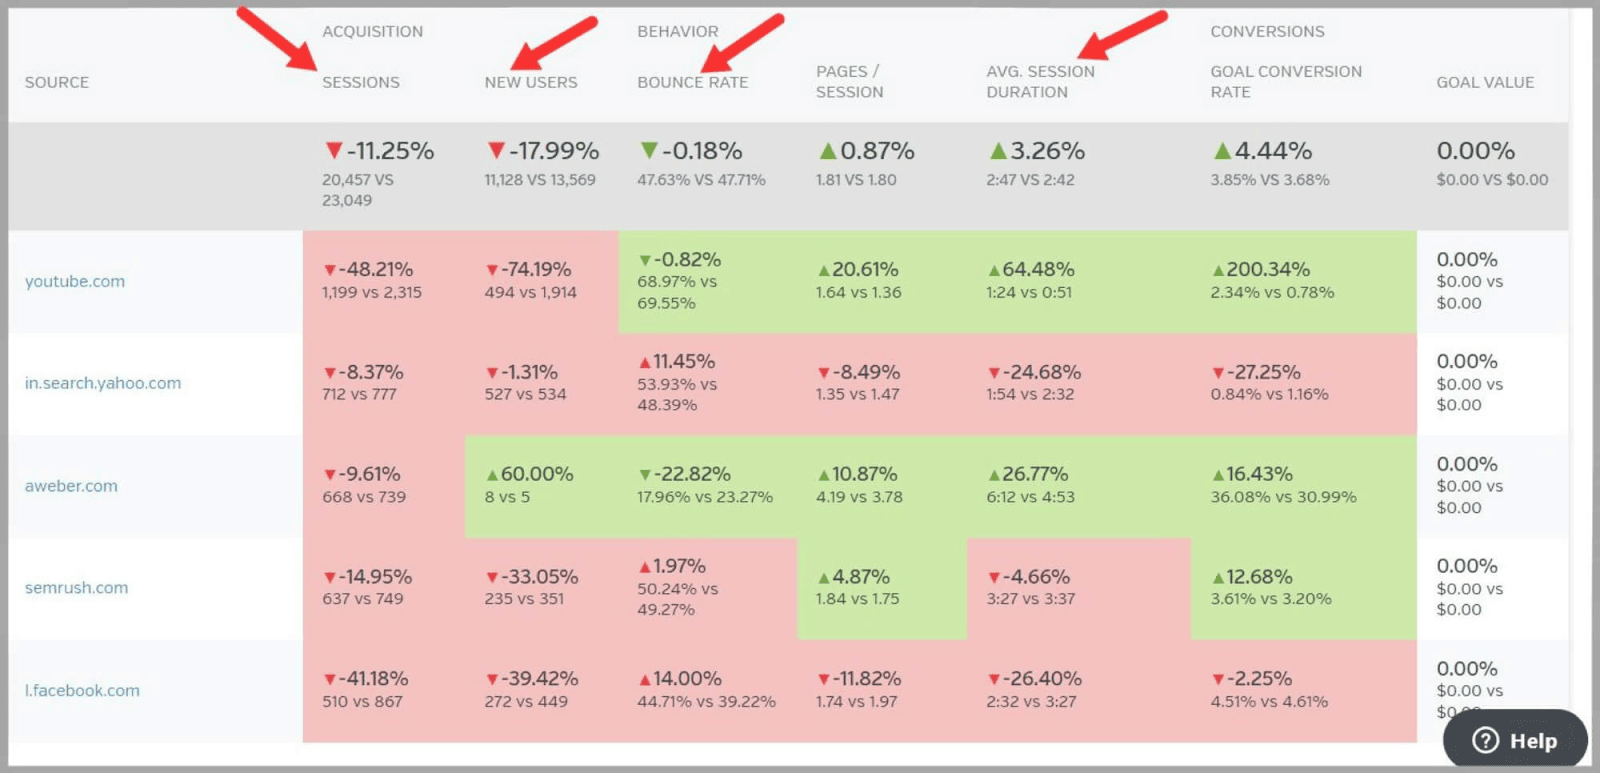
For example, if I want to see which sites are sending visitors my way I can take a look at the “Top Referrals” table.
Here, I can see detailed metrics about “Sessions” and “New Users” and compare the data from the current month to the past month.
It also gives me user behavior metrics such as “Bounce Rate” and “Average Session Duration.”
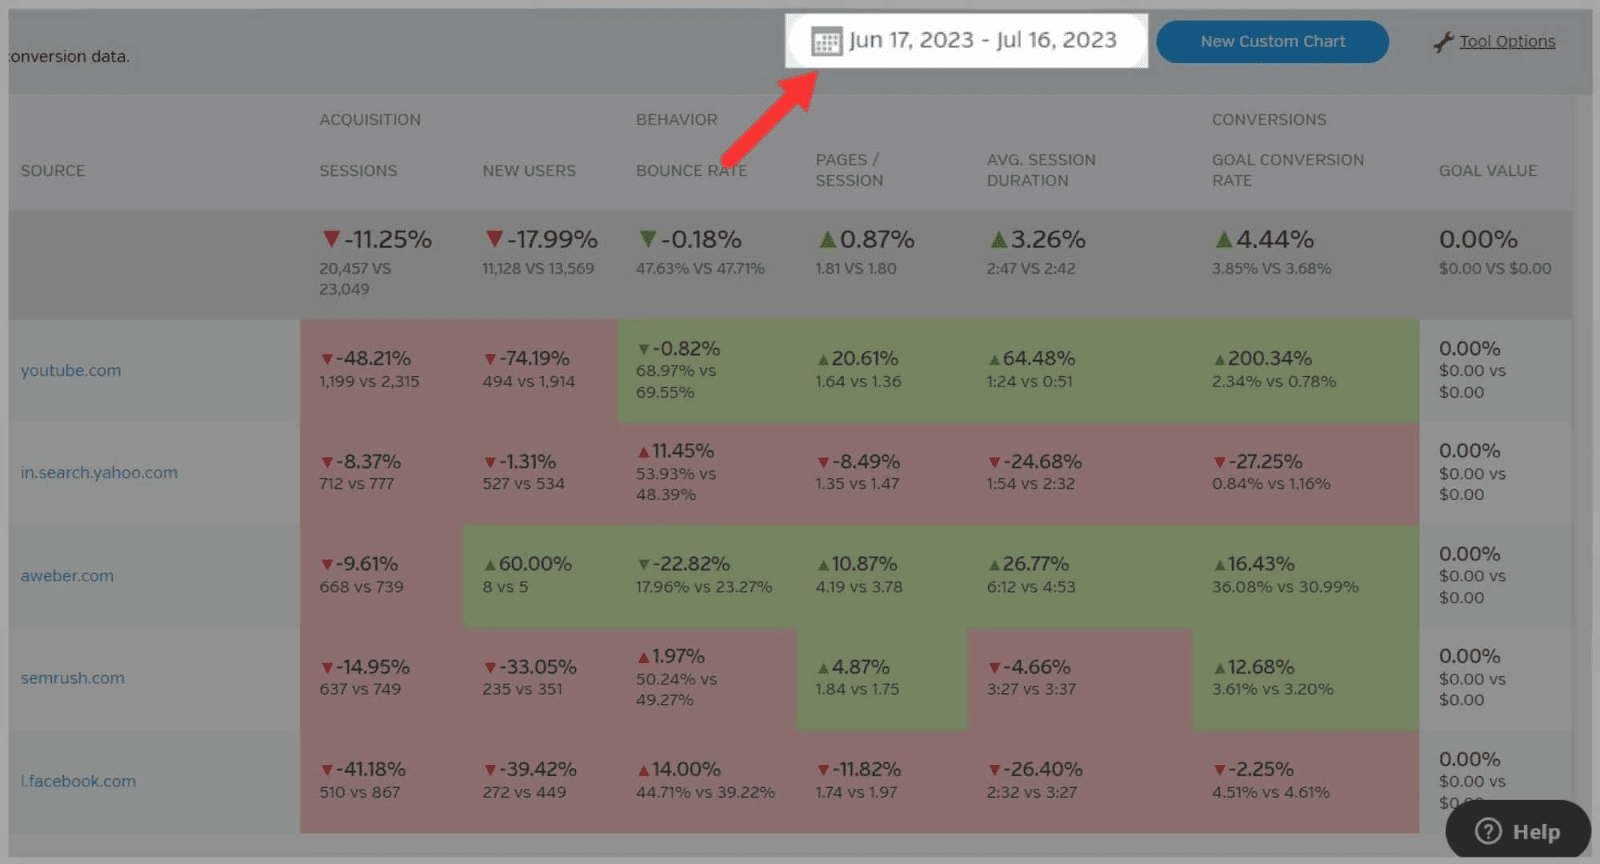
If I want to view the metrics for a different time period I can change this at the top right of the page. This will allow me to see what has or hasn’t improved over time.
By understanding the sources that bring in the most traffic, I can focus on optimizing my marketing efforts and content around these sources to drive even more traffic to my site.
For example, let’s say you have an ecommerce site that sells handmade jewelry and you notice that Pinterest is the top source of your traffic.
You could then create more appealing content that is optimized for Pinterest and send traffic from there to your site.
Moving on.
To the left of the screen, there’s a menu where you can choose which type of data you want to see.
They are:
- All Traffic
- All Referrals
- Content
- Campaigns
- Events
- Goals
- Audience
- Social
- Ads
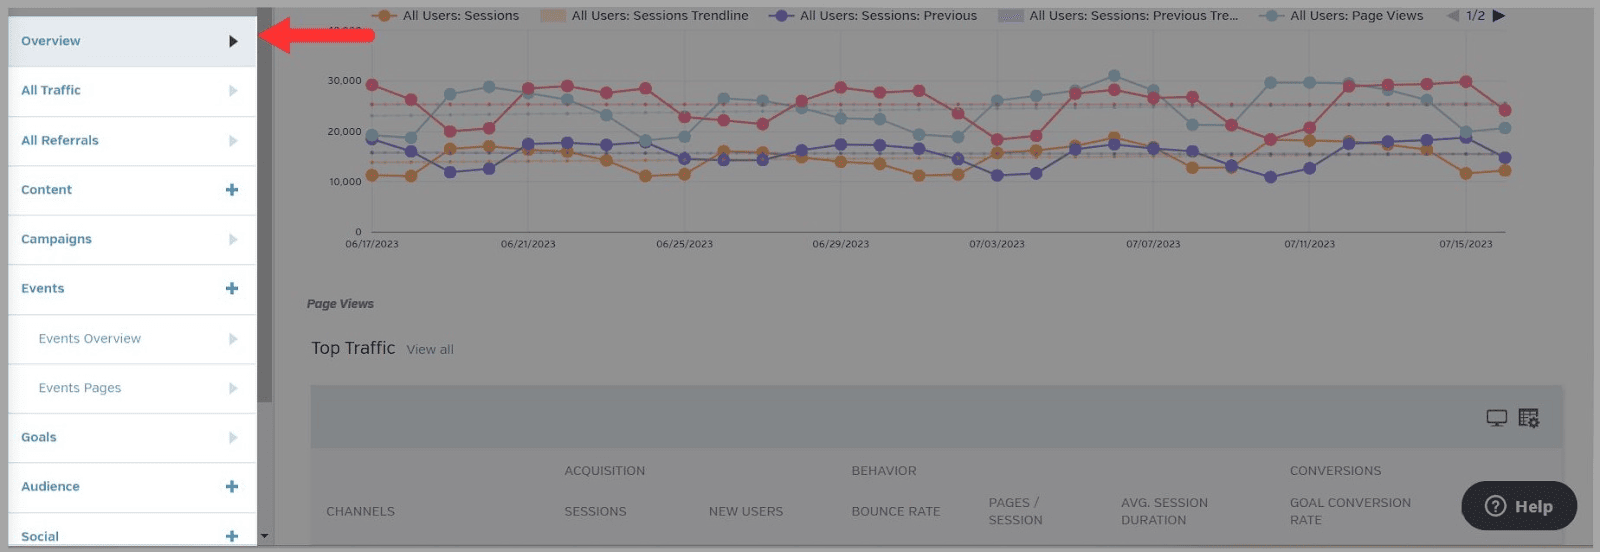
This means you can easily access all of the data that Google Analytics has collected for your site all within Raven Tools.
Pretty cool.
The SEO Metrics feature gives you a breakdown of useful data from Google Analytics that you can use to improve your SEO campaign.
The first page you land on is the “Site Engagement” page.
This gives you data about the following metrics for your organic traffic:
- Sessions
- Page Views
- Pages/Session
- New Sessions
- Bounce Rate
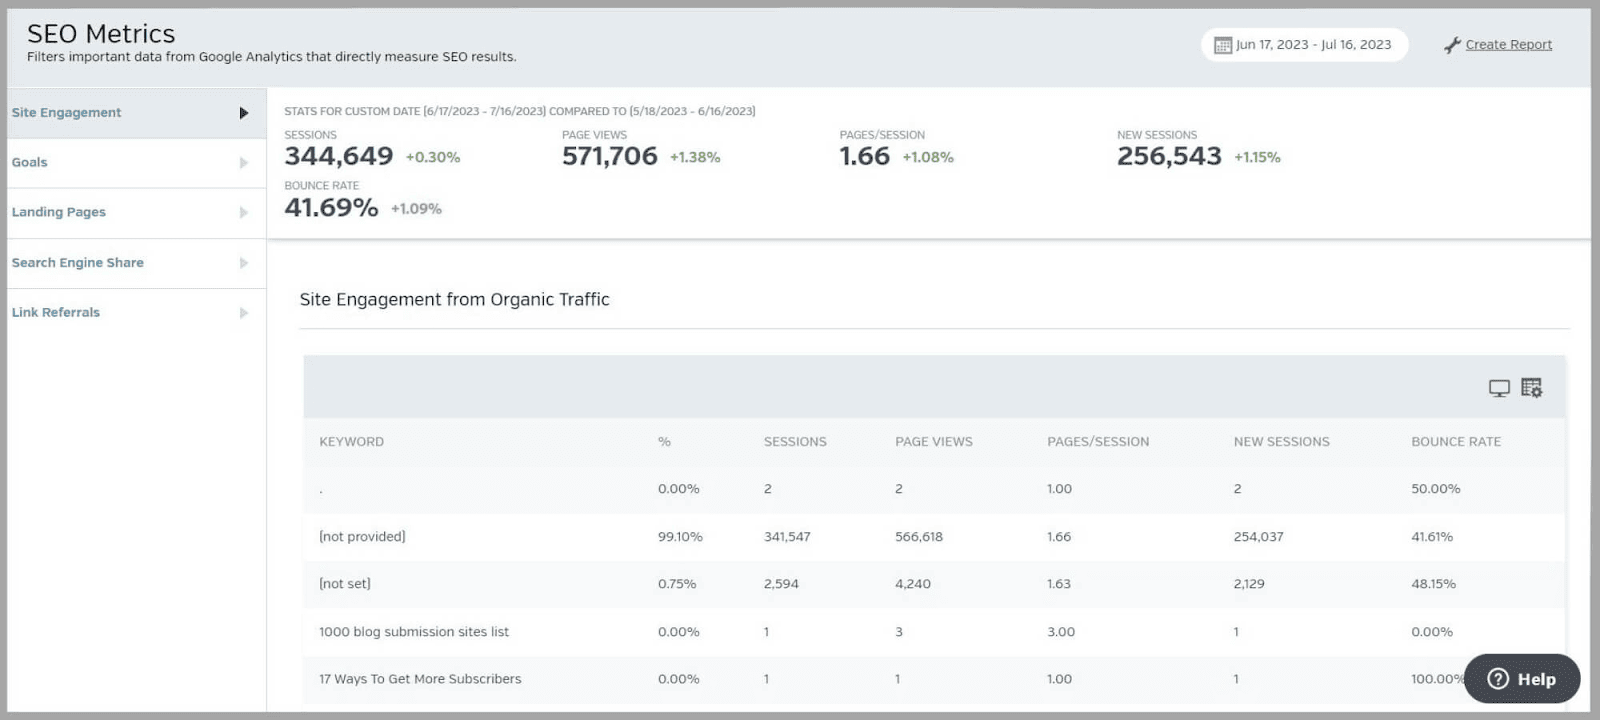
You can also change the time period it covers and create a report containing this data.
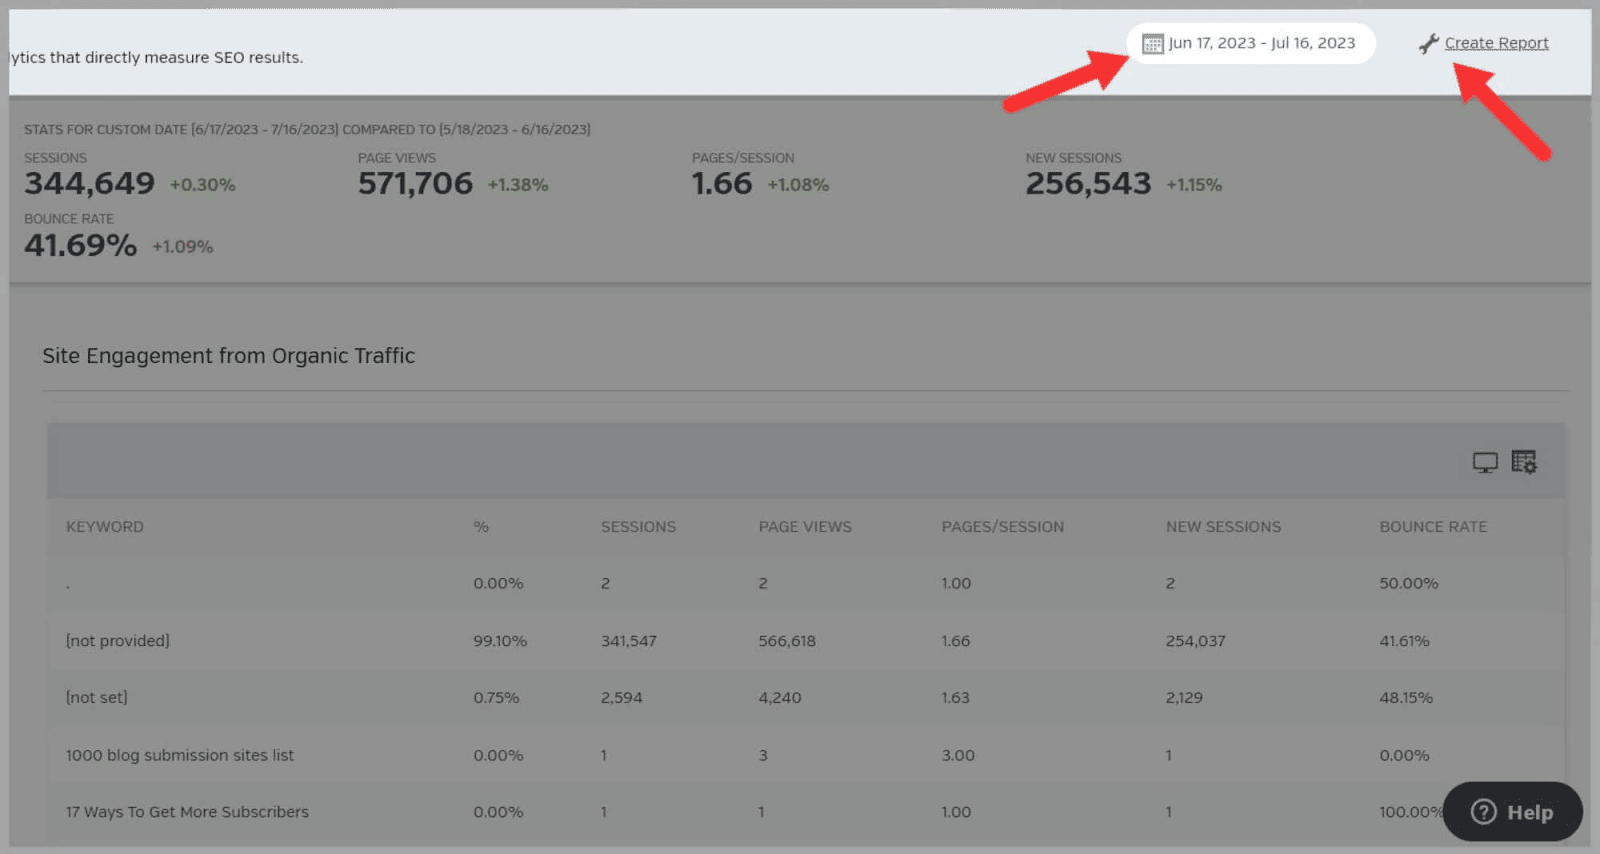
You might want to keep this report so you can track the progress of your site. Or, you could share it with clients to show how things are going with their sites.
At the left of the page, there are four more reports:
- Goals
- Landing Pages
- Search Engine Share
- Link Referrals
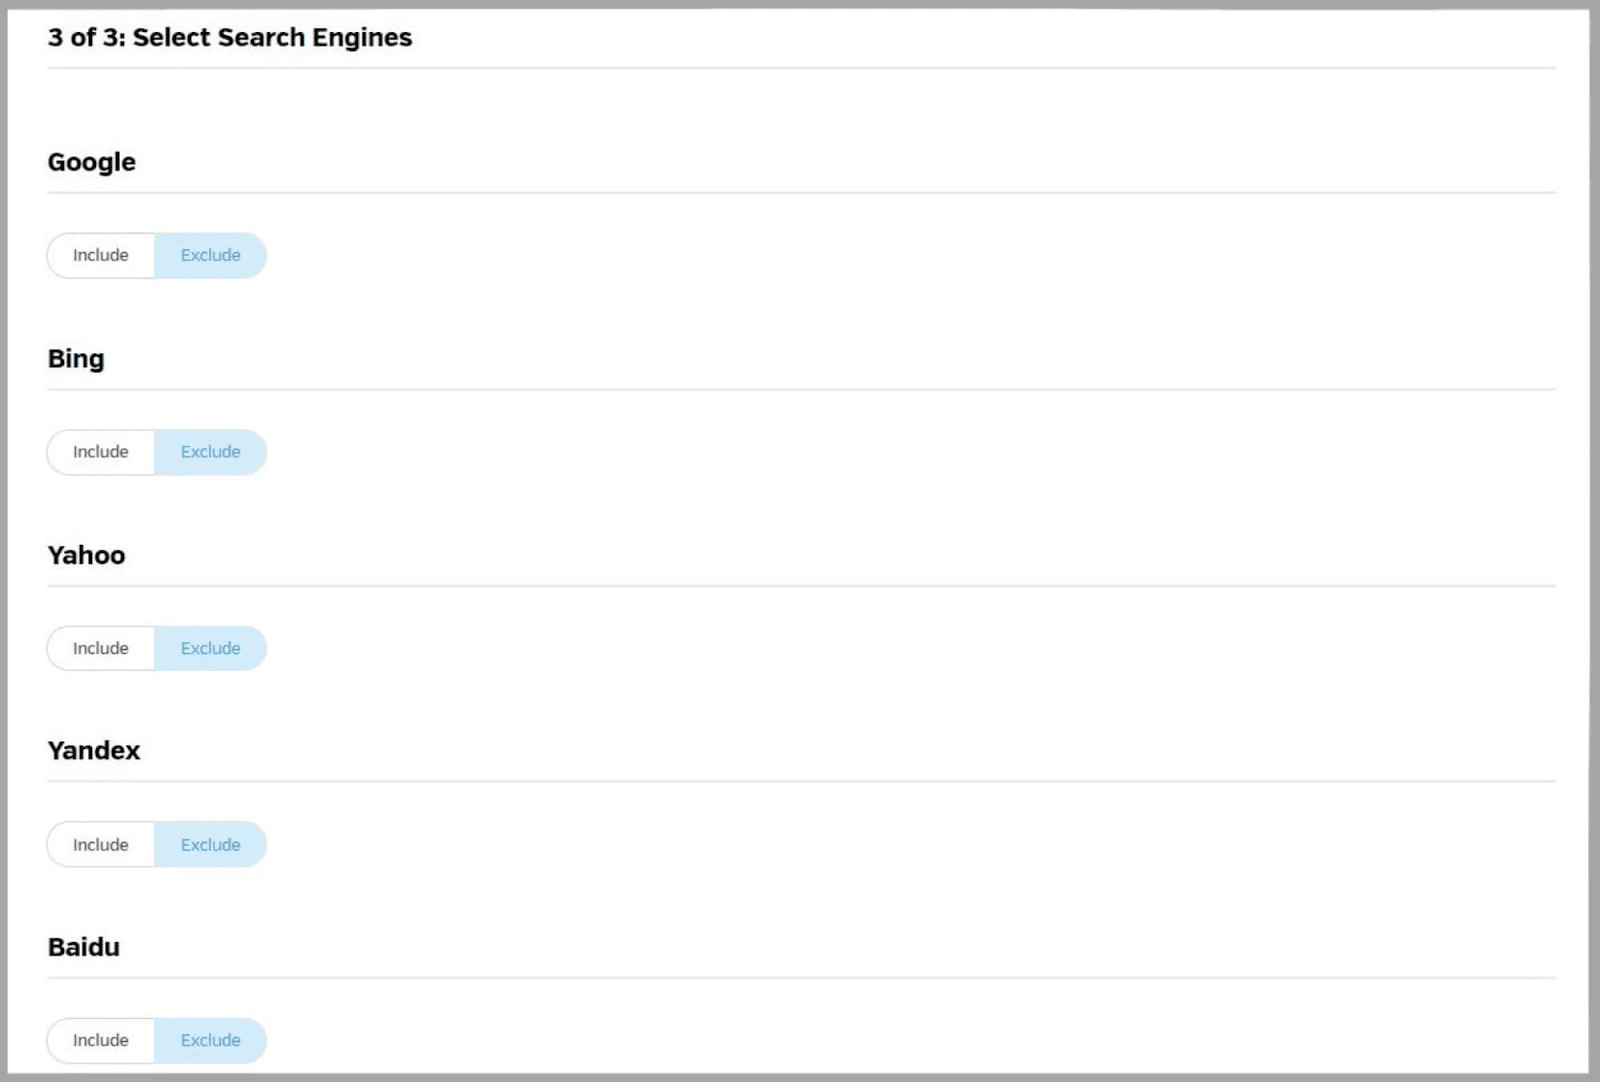
If I click on “Search Engine Share” I can see a percentage that tells me how much of my organic traffic is coming from each search engine.
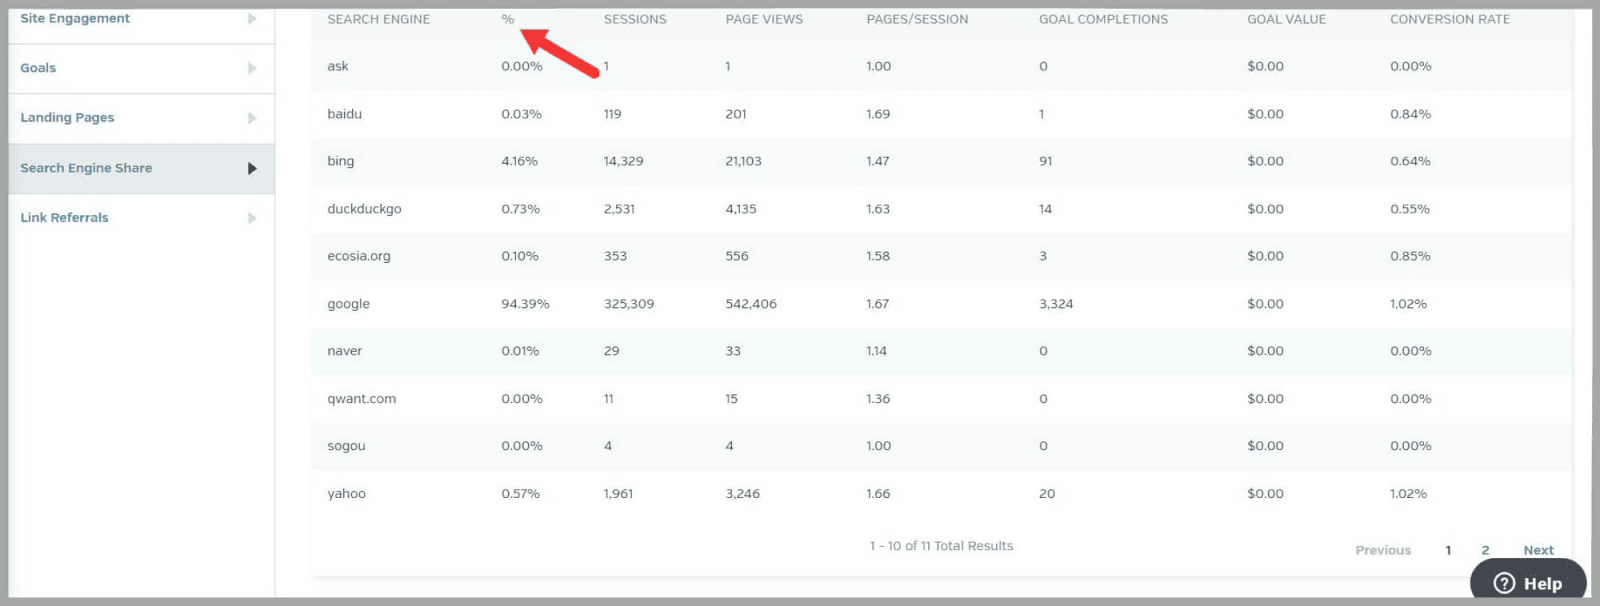
Unsurprisingly, the vast majority of my traffic is coming from Google at 94.39%.
Google Analytics 4
Google Analytics 4 has been the default version of Google Analytics since 07/01/2023.
Still, some users haven’t made the switch yet so Raven Tools has separate tools for each.
The Google Analytics 4 “Overview” page looks the same as the Google Analytics. The only difference is the options on the left of the page.
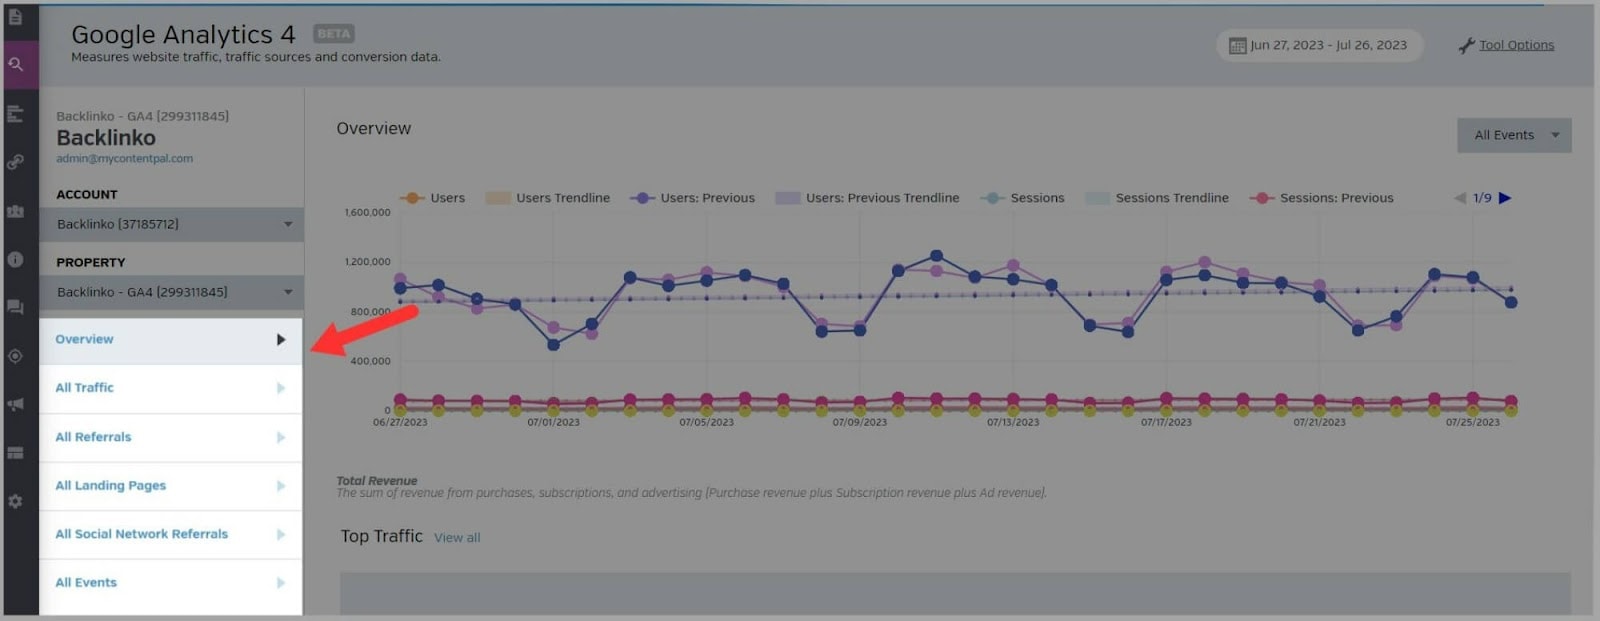
The tabs are:
- Overview
- All Traffic
- All Referrals
- All Landing Pages
- All Social Network Referrals
- All Events
If you click on “All Landing Pages” for example, and scroll down, you see a table with a list of your landing pages.
You also see a lot of metrics.
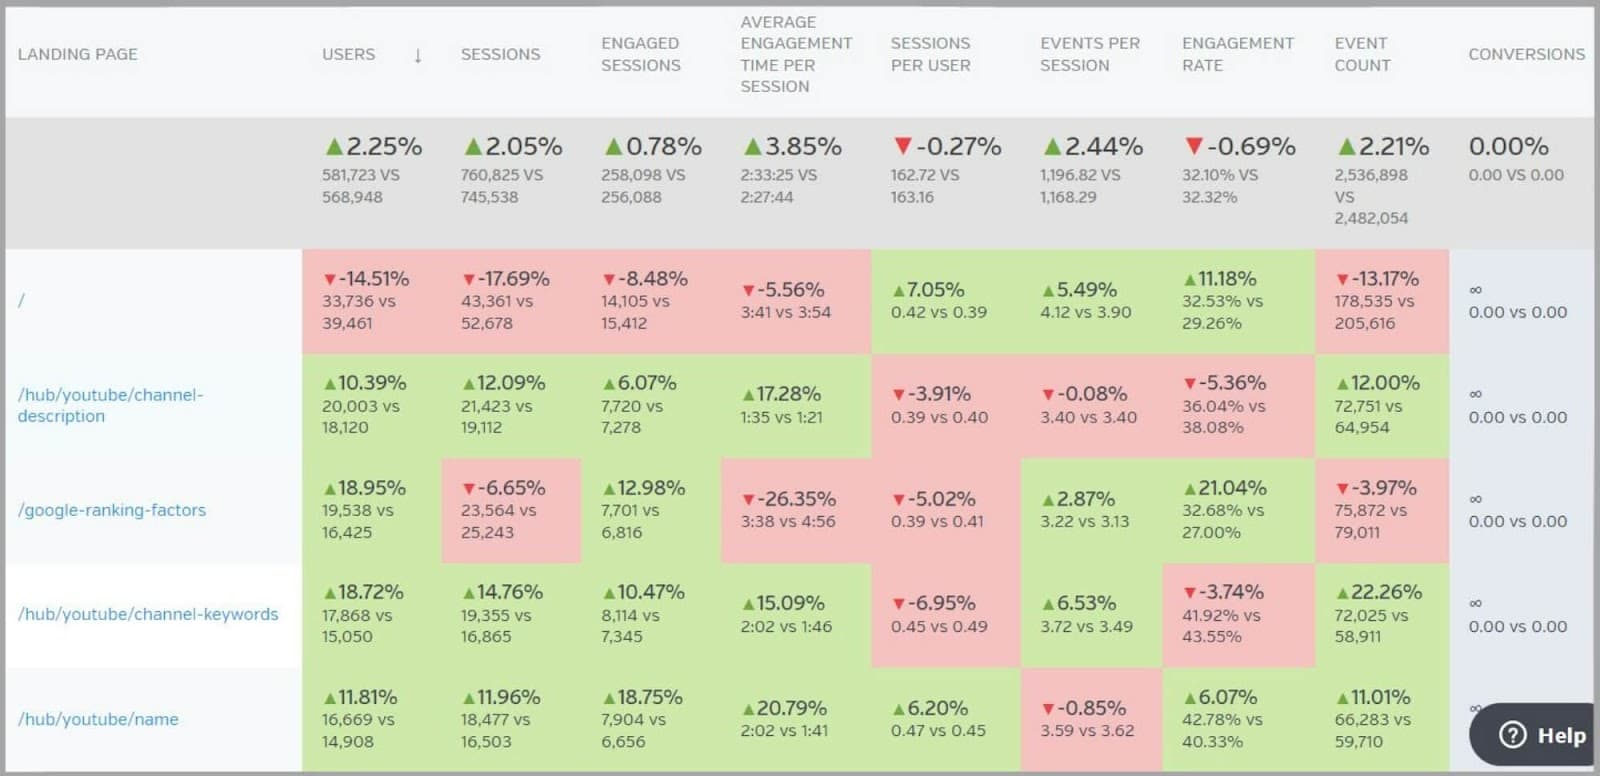
These are:
- Users
- Sessions
- Engaged Sessions
- Average Engagement Time Per Session
- Sessions Per User
- Events Per Session
- Engagement Rate
- Event Count
- Conversions
Let’s focus on the “Engagement Rate” metric.
This is calculated by dividing “Engaged Sessions” by “Sessions.”
The “Engaged Sessions” metric represents sessions that were longer than 10 seconds, or, sessions that involved two or more screen views or a conversion event.
The “Sessions” metric shows you how many sessions began on your site.
I can see that the “Engagement Rate” for this landing page is 21.04%
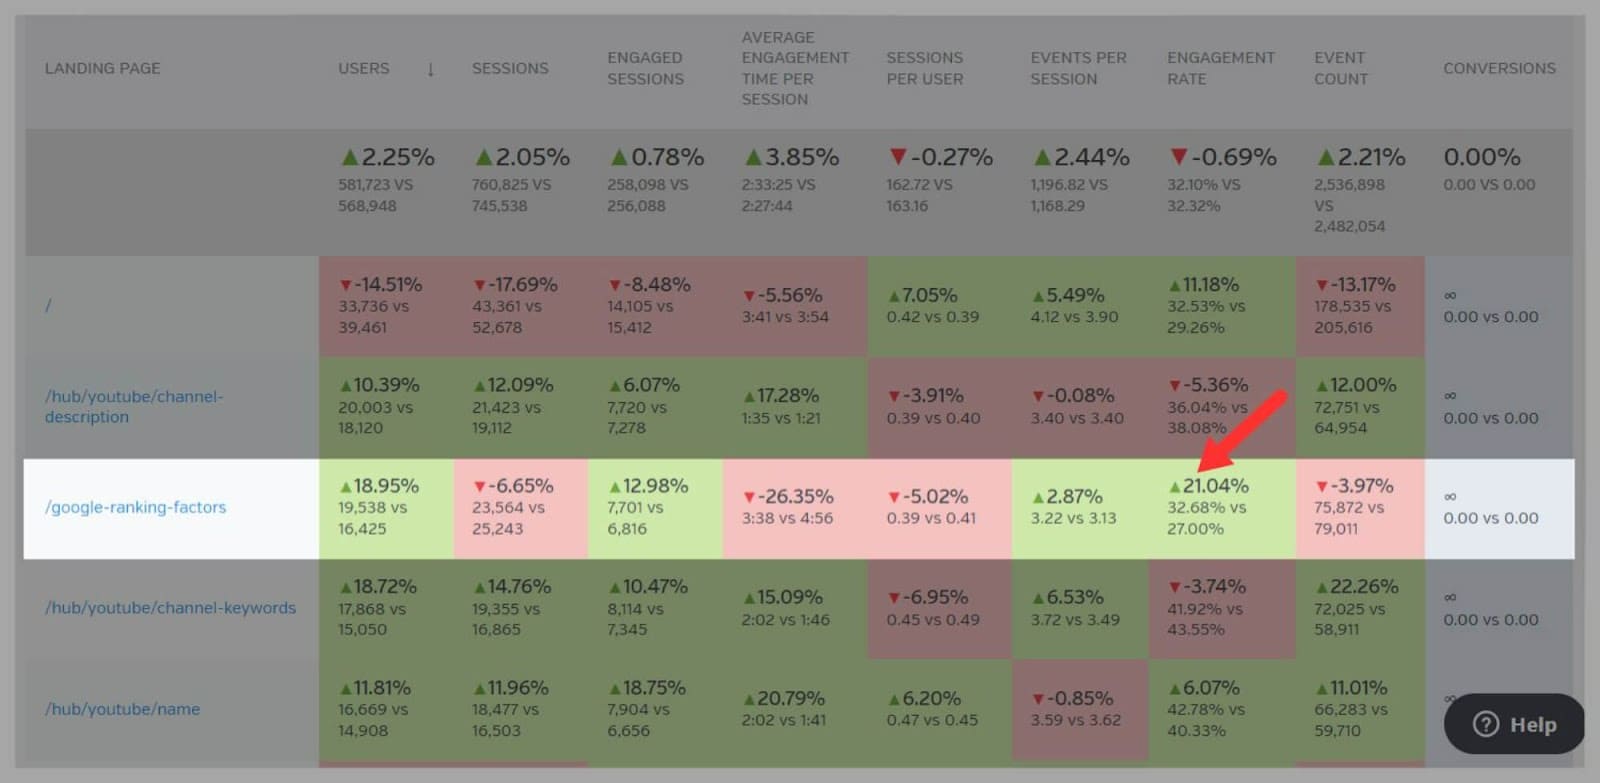
Now, a good percentage for this metric is generally considered to be between 60% to 70%. So, clearly the percentage for this page is quite low.
There could be several reasons for this, such as:
- The page might have an unappealing design
- It could lack a clear purpose or provide dull and irrelevant content
- Maybe there are long blocks of text that are overwhelming which deter users from engaging with it
- It possibly takes too long to load
- There could be no clear call-to-action (CTA)
This is why the “Engagement Rate” metric is super useful because it makes you aware of on-page elements that are causing low engagement rates. Armed with these insights, you could then take the necessary steps to optimize the page.
Rank Tracking
The Rank Tracking tool gives you the ability to keep tabs on your and your competitors’ search engine rankings. You can also track how specific keywords are performing in the SERPs.
SERP Tracker
This feature allows you to gather information about how specific keywords and domains are ranking in the SERPs. You can track your own domain as well as the domains of your competitors.
The SERP Tracker tool has four different features:
- Keyword Suggestions
- Keywords
- Competitors
- Rank Checker
The “Keyword Suggestions” feature is a super fast way to find some terms you could target to optimize your site.
All you need to do is type in a keyword and then hit “Research.”
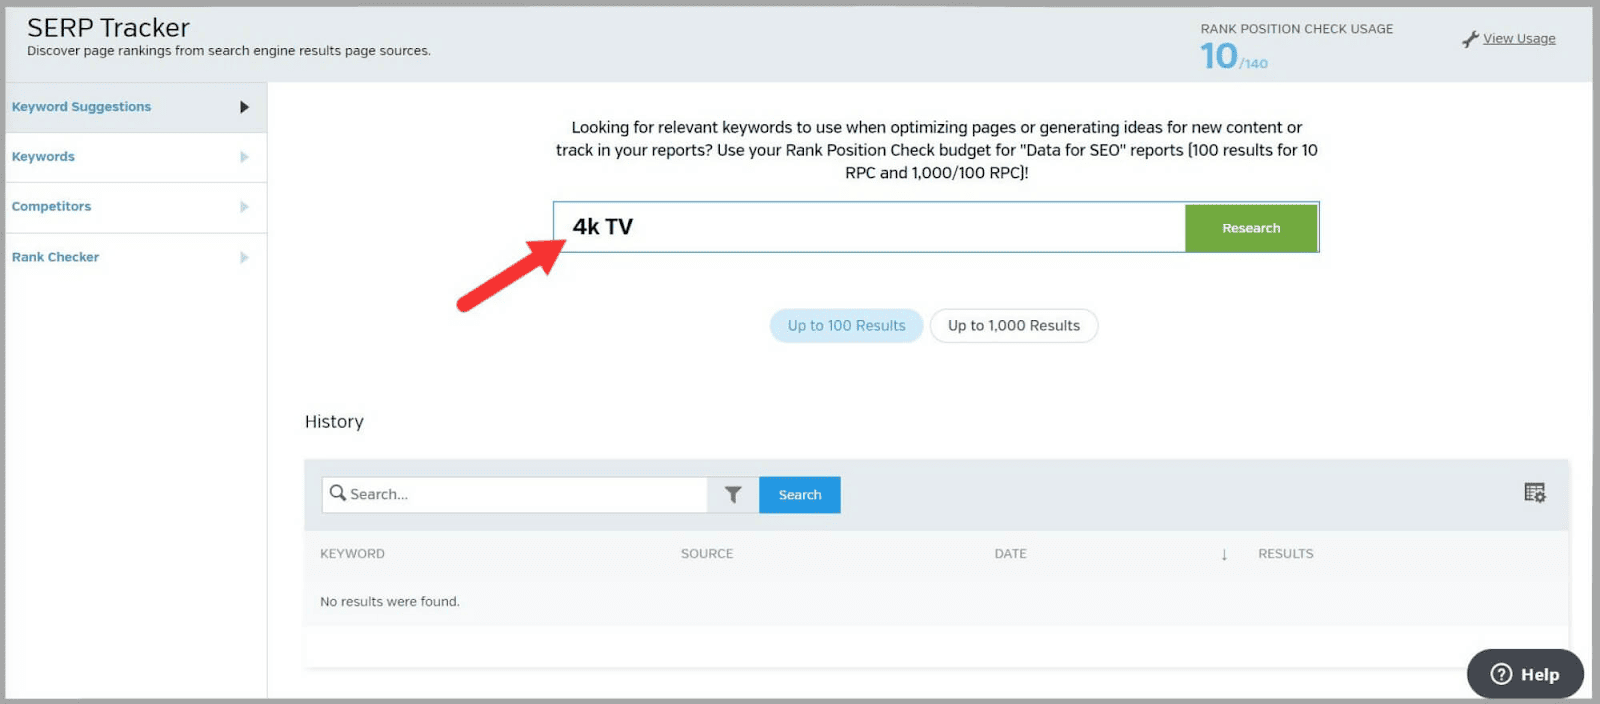
Raven Tools then gives you a list of related keywords along with data about search volume, competition, and cost-per-click (CPC).
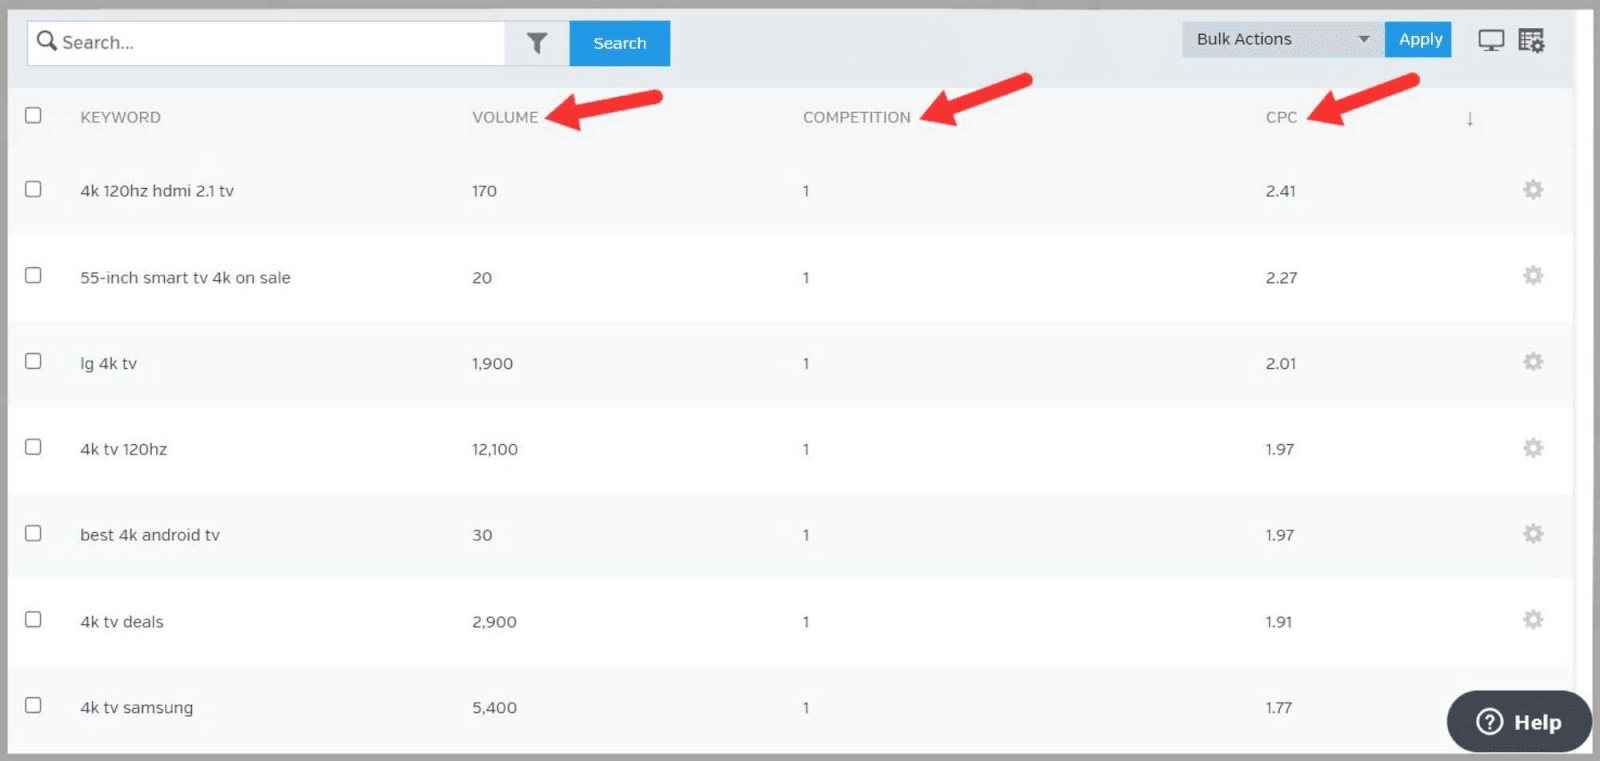
Now, let’s say you want to keep track of the keyword rankings for these terms over time.
You need to select the keywords you like and then choose the “Add To SERP Tracker” option.
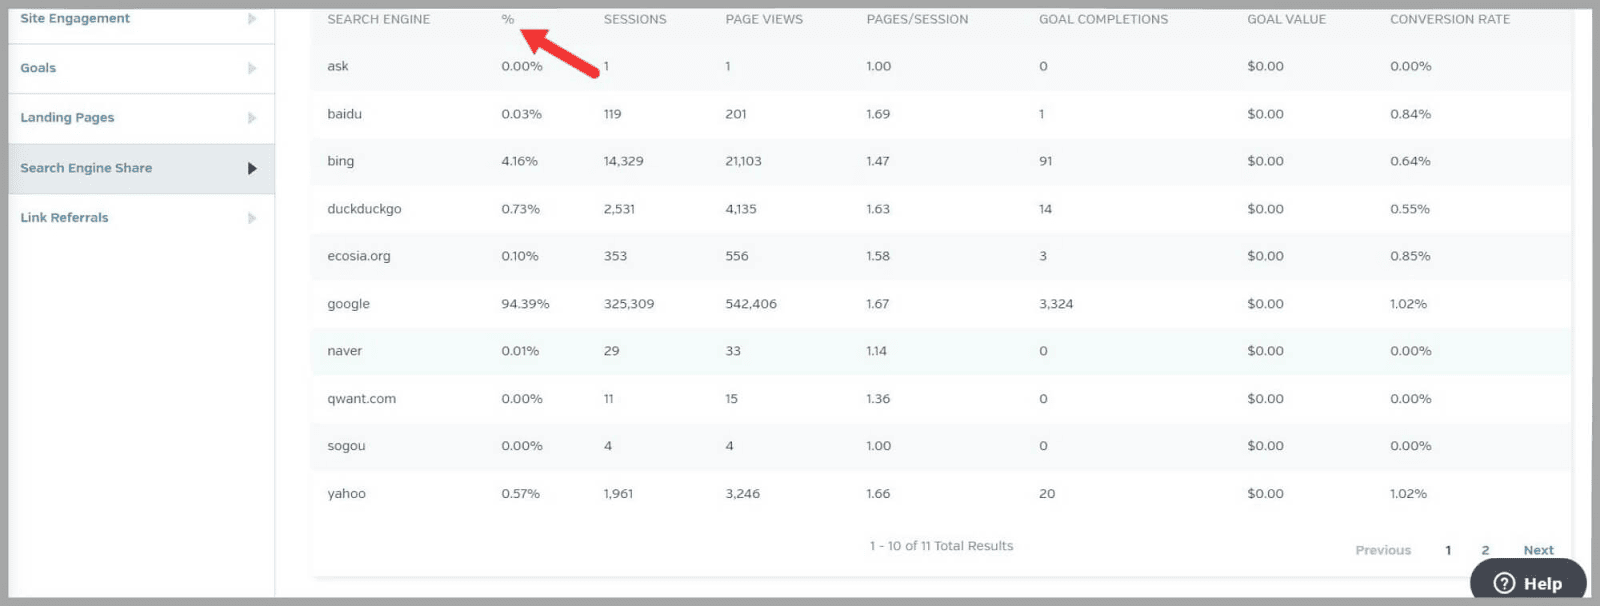
Then, you need to choose the tracking frequency. This means how often you want the terms to be tracked, whether it be daily, weekly, or monthly.
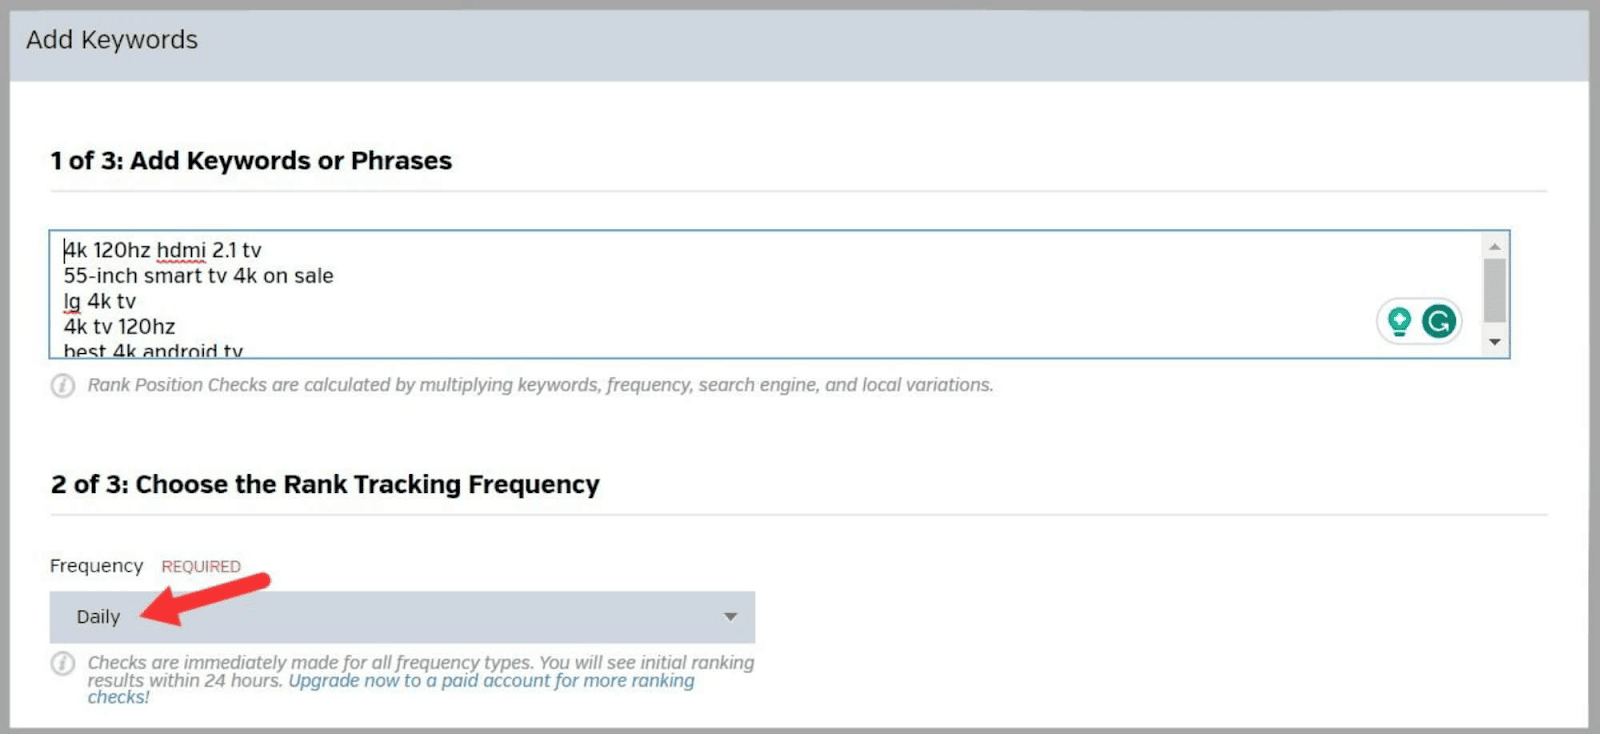
Next, you select which search engines you want the tool to use for its keyword tracking.
Then, just click “Review and Publish”
The downside to this tool is that you have to wait up to 24 hours for the tracking report to come through.
Still, it’s worth the wait.
By reviewing the ranking positions of your targeted keywords you can:
- Assess the effectiveness of your optimization efforts.
- Identify fluctuations
- Make data-driven decisions to improve your site’s visibility in SERPs.
Google Search Analytics
For this tool, you need to link Raven Tools to your Google Search Console account.
The tool then pulls in data from GSC which gives you insights into how your site is performing in Google organic search results.
When you open this feature, you’ll see a graph.
It compares your Average Position for related queries over the past month to the previous month.
There are also three other graphs you can view data for:
- Clicks
- Impressions
- Click-through-rate (CTR)
Here’s what the CTR graph looks like.
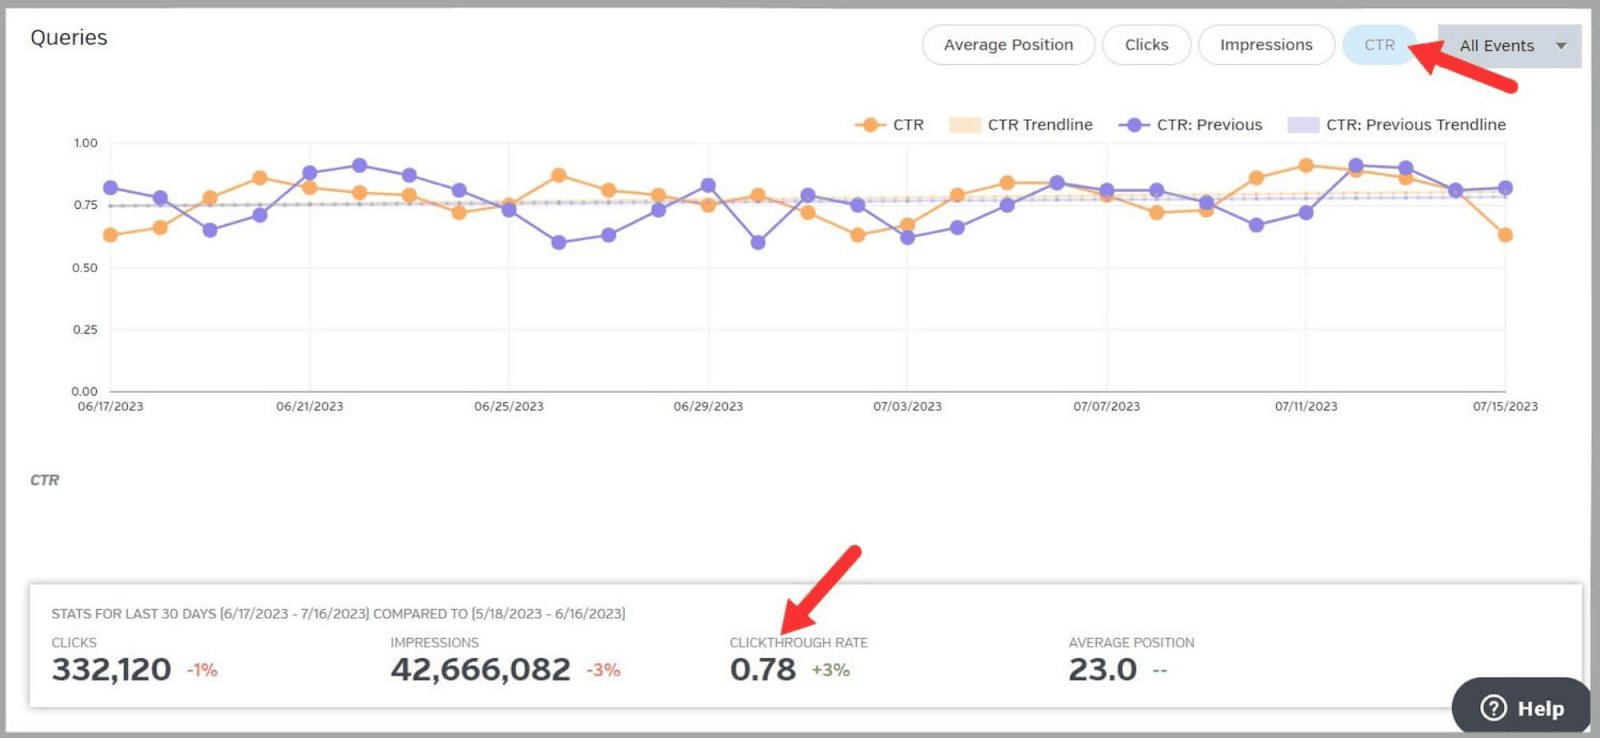
You can get a quick overview to see if your CTR has increased or decreased over a certain period of time. Luckily for me, mine has improved by 3% in the past month compared to the previous month.
On the left of the page, you’ll see:
- Queries
- Pages
- Countries
- Devices
- Search Appearance
If you click on “Queries” and scroll down you’ll see a list of your site’s keywords.
Raven Tools provides you with the following metrics:
- Clicks
- Impressions
- CTR
- Position
- Position Change
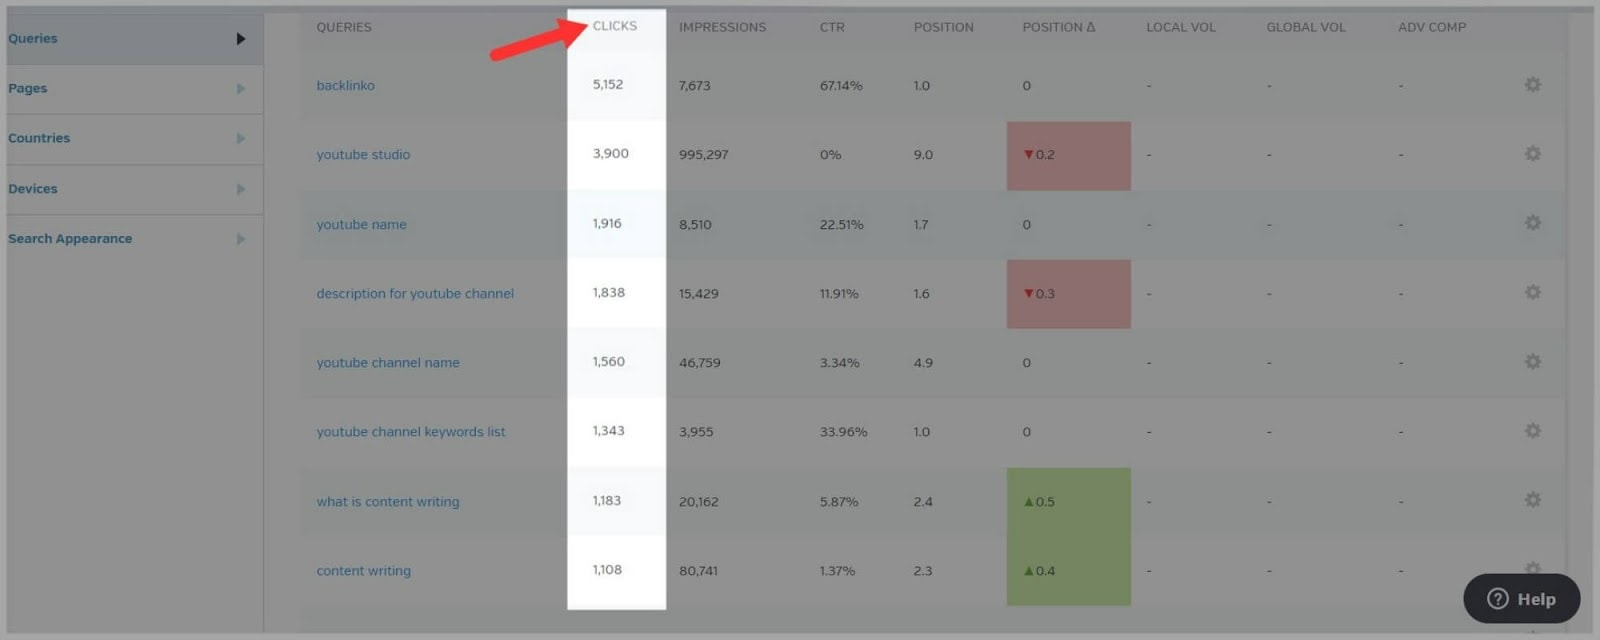
Here I can see the number of clicks I’m getting for specific keywords and what ranking positions they’re in.
I can also see which keywords have moved up or down in the SERPs.
If you click on “Pages” you’ll see a list of your site’s pages along with the same metrics as above.
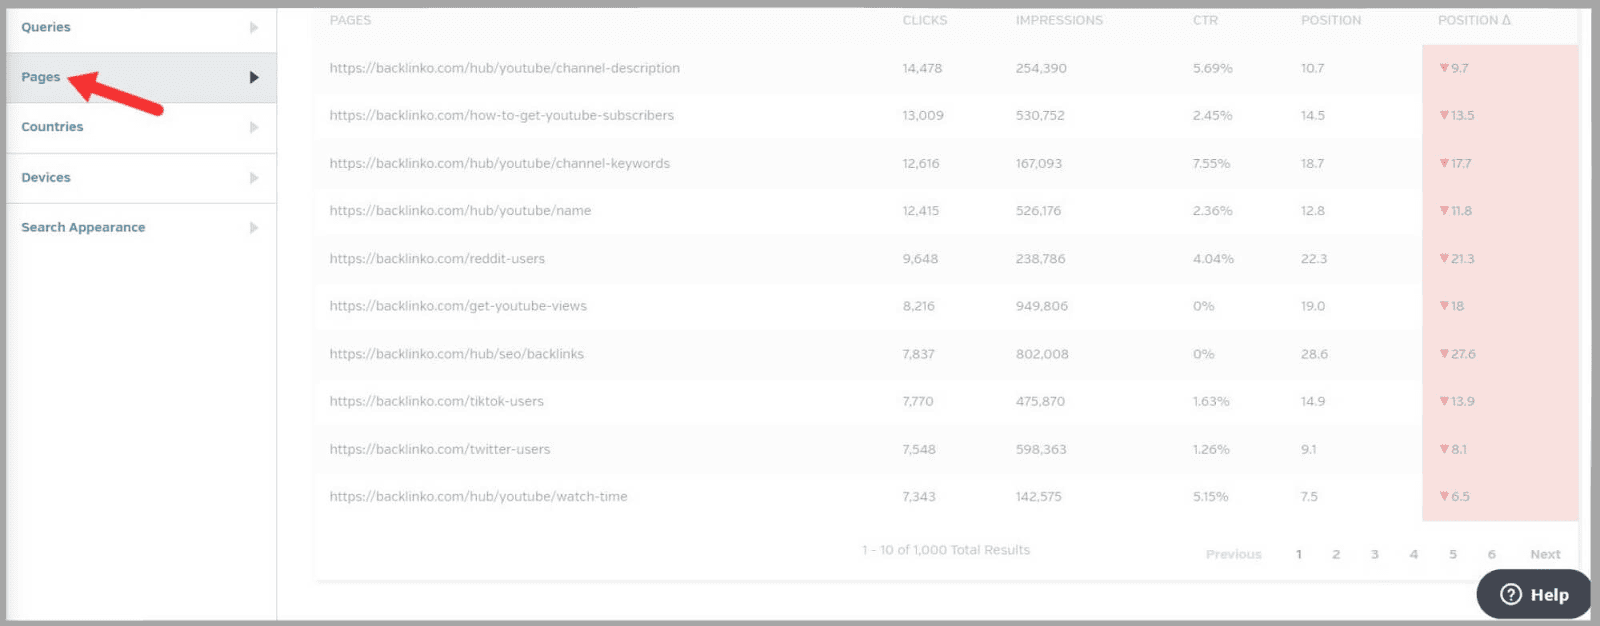
Clicks:
You can view data for the amount of clicks your pages are earning. Pages with a higher number of clicks are obviously more popular.
By analyzing these pages you can gain insight into what content or topics appeal to your target audience. Therefore, you can focus on creating similar content in the future to drive more clicks and traffic to your site.
You should also analyze the pages that receive fewer clicks as this will help you identify optimization opportunities. It could be possible that your meta titles and meta descriptions don’t align with the users’ interests.
Work on improving them so that they meet the user’s search intent. This could increase your clicks.
Moving on.
If you click on the “Countries” tab, you can see how many “Clicks” and “Impressions” you’re getting from specific countries.
Once you’ve identified the regions that hold your biggest audience, you can focus on creating content that resonates with users from these countries.
The “Devices” tab shows you the same metrics for desktop, mobile, and tablet devices.
This allows you to gain insights into how the majority of your users are accessing your site.
If they’re mostly visiting your site on mobile devices then clearly you need to make sure your site is fully optimized for mobile.
Position and Position Change:
The “Position” metric is helpful as it shows you what position your pages are currently ranking in.
The “Position Change” metric tells you if your rankings for these pages have moved up or down in the SERPs.
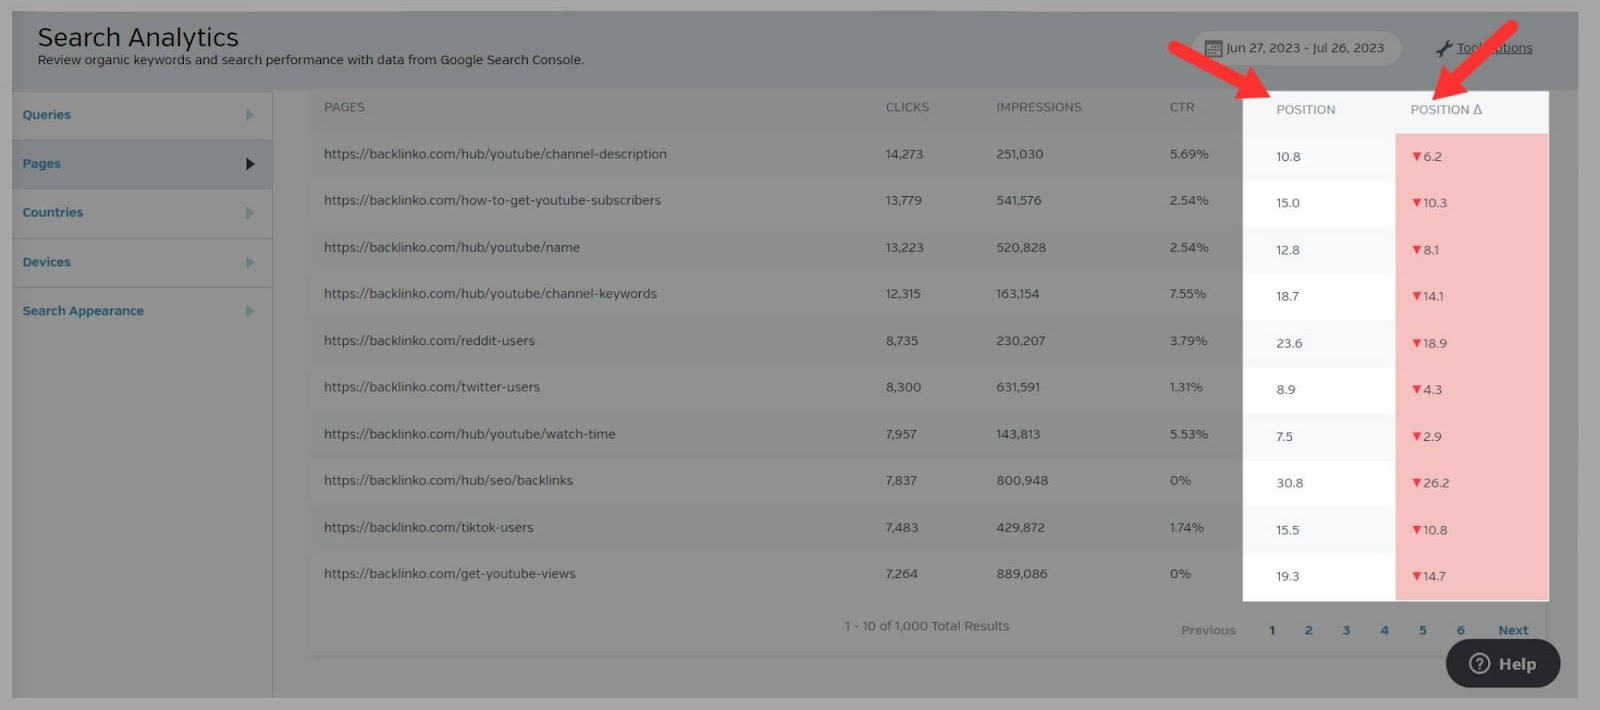
If one or more of your pages has moved down the rankings, then you need to find out why.
One possible reason could be due to an algorithm update. So, you’ll need to check when the update took place and see if it matches up with the time period when your pages lost rankings.
CTR:
Here you can see the click-through rate of your pages.
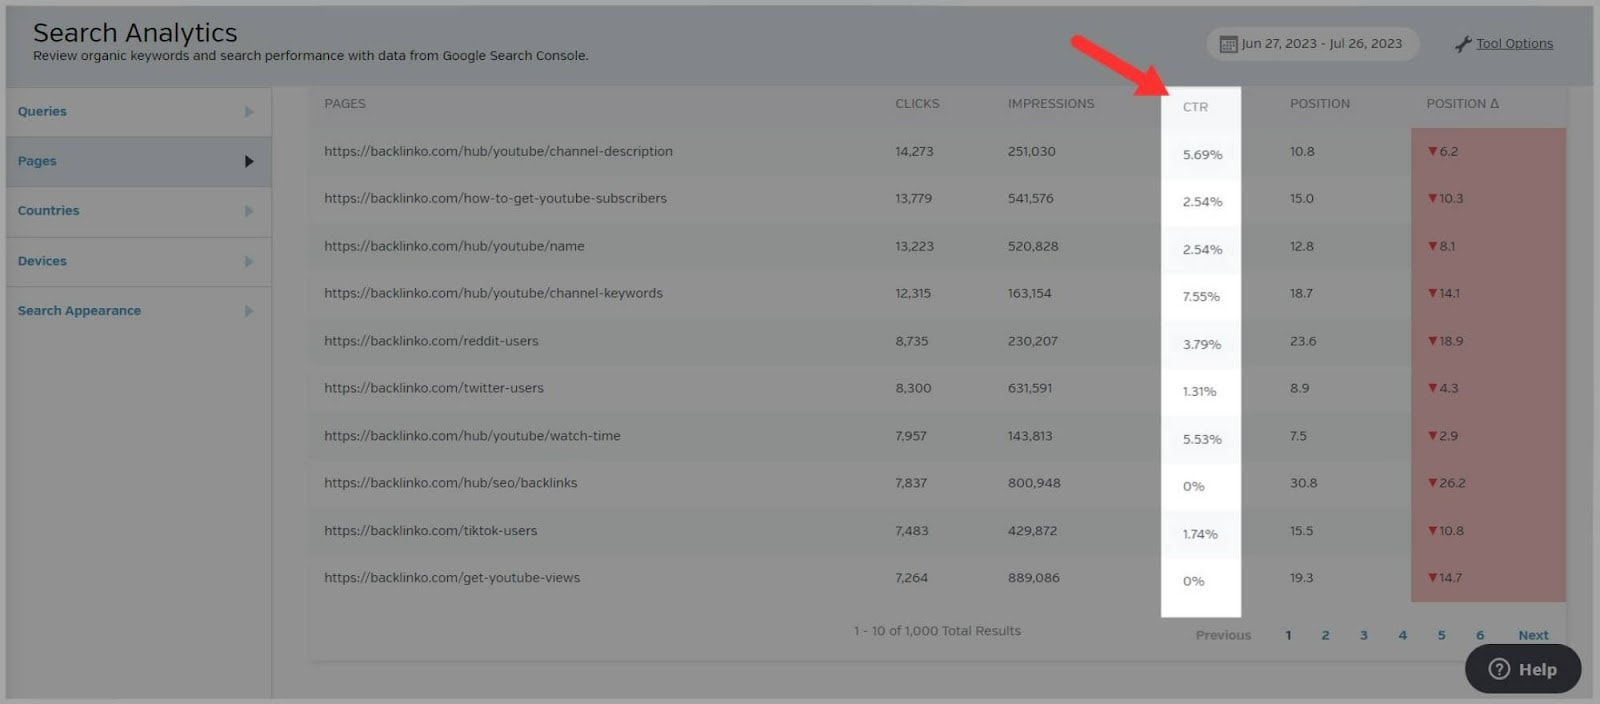
It’s a super helpful metric because it shows you which pages have an improved “CTR” and which ones aren’t performing as well.
There are a couple of reasons why your pages might have a low CTR. The first one being, they rank outside of the top ten search results on page one. If this is the case for some of your pages then you’ll need to optimize them to improve their rankings to get on page one. The higher your pages rank on the first page of Google, the better your CTR will be.
Before I talk about the second reason, you first need to understand what “Impressions” are.
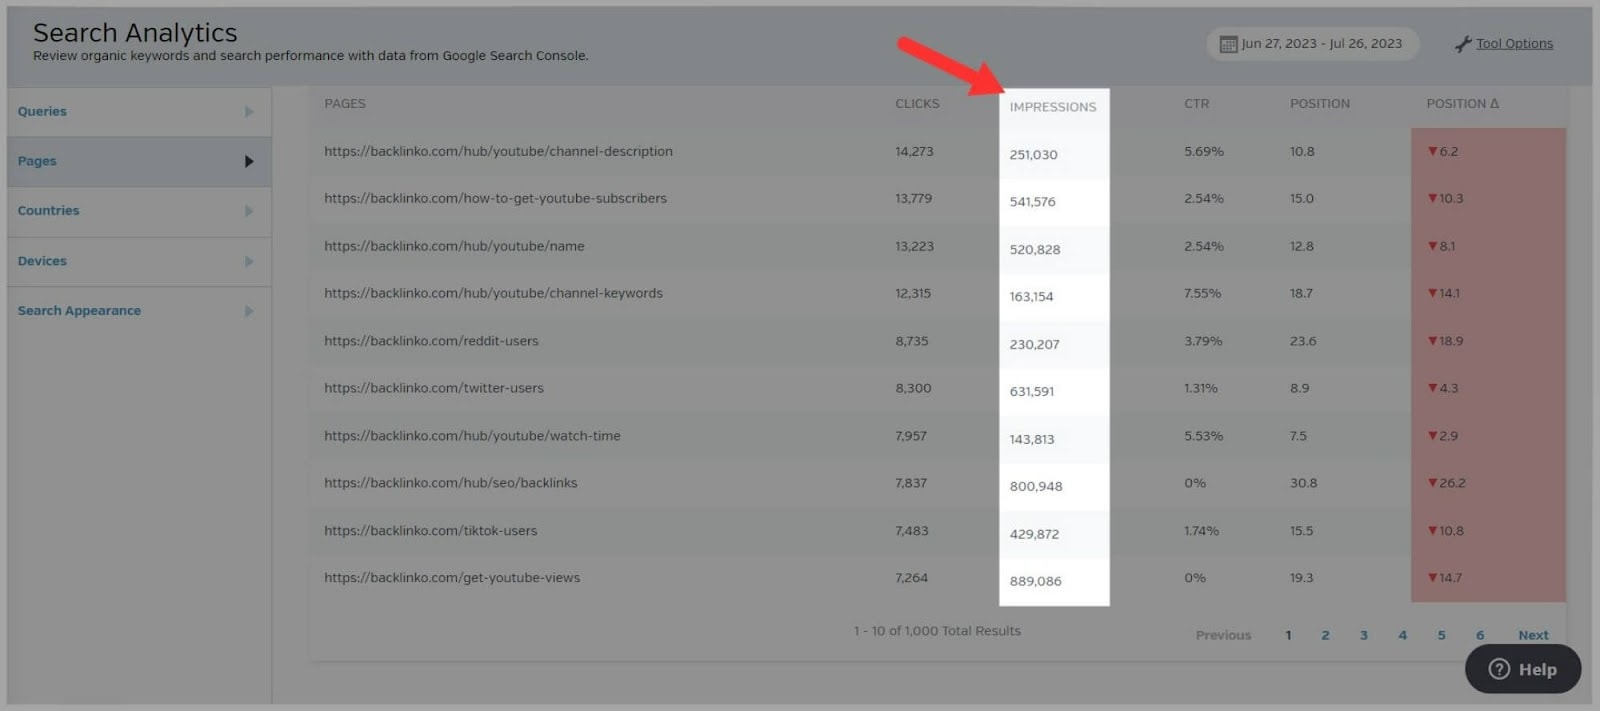
The “Impressions” metric measures how many times search engine users have been exposed to your pages in the SERPs. You should analyze this metric alongside your “CTR” metrics.
Here’s why:
If a page has a high number of “Impressions” but a low “CTR” this could mean that your meta titles and descriptions are poorly optimized. This is the second reason why your pages might have a low CTR.
Think about it, if your pages are showing up in the SERPs for search queries but users are choosing not to click on your link, then it’s quite obvious your titles and meta descriptions are the problem. You need to analyze them and ask yourself, are these page titles and descriptions compelling enough to attract users’ interests and entice them to click on your links?
On top of that, you should implement schema markup on your pages if you haven’t done so. This increases the chances of search engines displaying rich snippets under your link which makes it more attractive to click on. This can potentially increase your click-through rates too.
Pretty neat.
Link Building
The Link Building tool helps you analyze the backlink profiles of your and your competitors’ domains. You can also save any backlink data you uncover and organize it effectively for different campaigns.
Backlink Explorer
This tool shows you the sites that are linking to your or your competitors’ pages and gives you an indication of the quality of those sites. It also provides you with data on up to 50,000 backlinks.
Now, I must say. The Link Building section is laid out in a slightly confusing way.
The first tool you’ll see is the “Link Manager.”
The thing is, you probably won’t have any links to manage yet in Raven Tools.
So, the first thing to do is click Backlink Explorer instead.
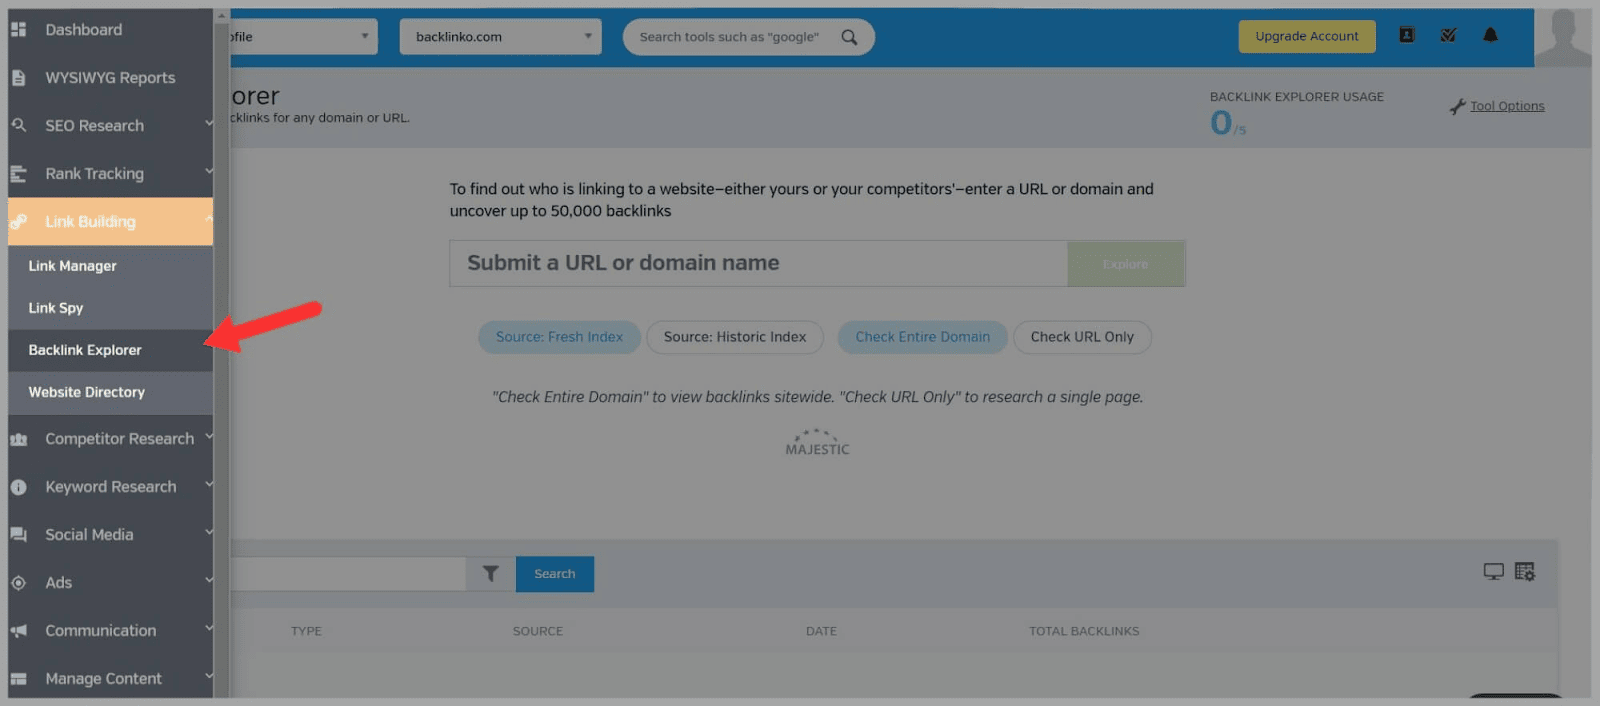
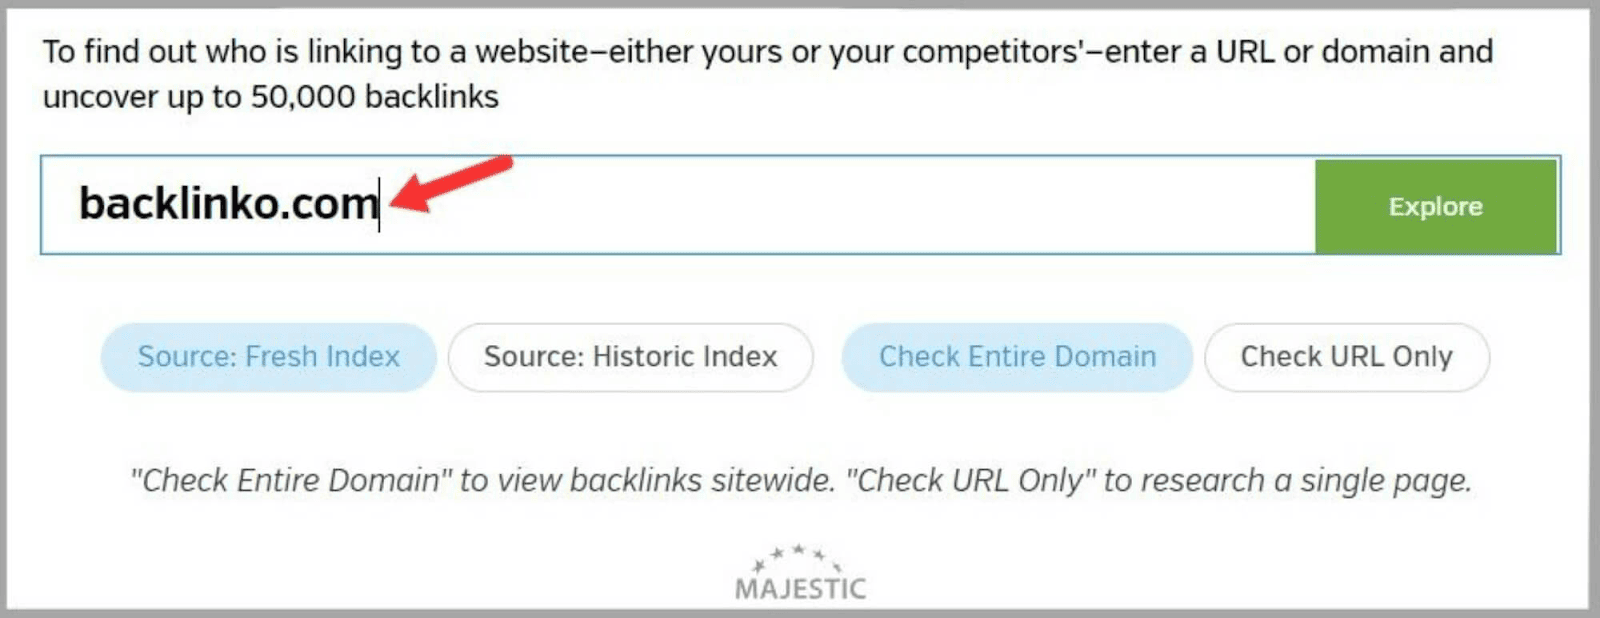
The Backlink Explorer allows you to view your own site’s backlinks or the backlinks of your competitors.
To get going, enter a domain and hit “Explore.”
Next, click on the domain.

Then, you’ll see a list of the source URLs for that site’s backlinks. Source URLs are the sites that the backlinks are coming from.
You’ll also see the “Target URL”, “Citation Flow”, and the “Anchor Text” that was used for the link.
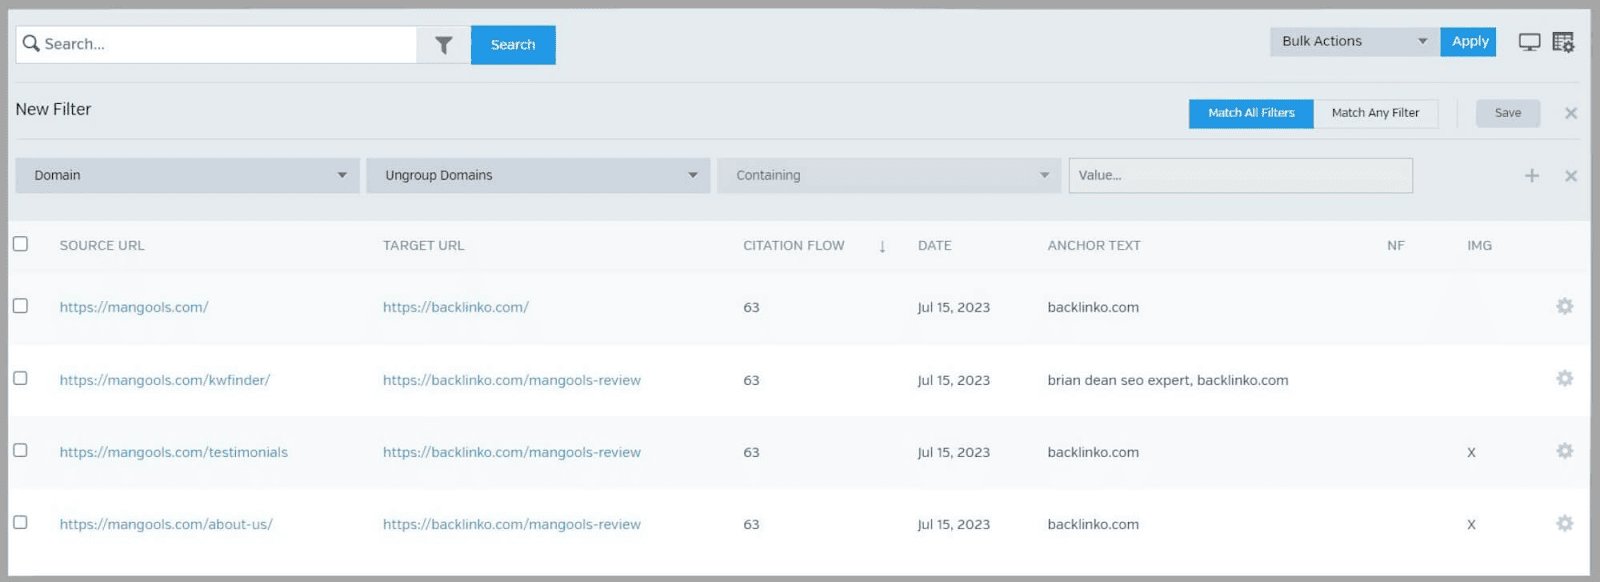
The “Citation Flow” metric represents a numerical value from 0 to 100. It highlights how much influence the source URL is expected to have. The number is calculated based on:
- the number of sites that link to the source URLs
- and the quality and authority of these sites
So, if the score is closer to 100, then that would indicate a better-quality link coming from the source URLs.
The tool also has a filter option that you can use to see only Nofollow links as well as image links.
Overall, it isn’t a bad backlink analysis tool but it’s definitely nothing compared to the likes of
Semrush’s Backlink Audit and Analysis tools offer much more detailed data.
That being said, if you want to keep track of your or your competitors’ links from Backlink Explorer then you can use the Link Manager tool to keep them organized.
Here’s how you do it: select the boxes next to the links and then choose the “Add to Link Manager” option in the drop-down.
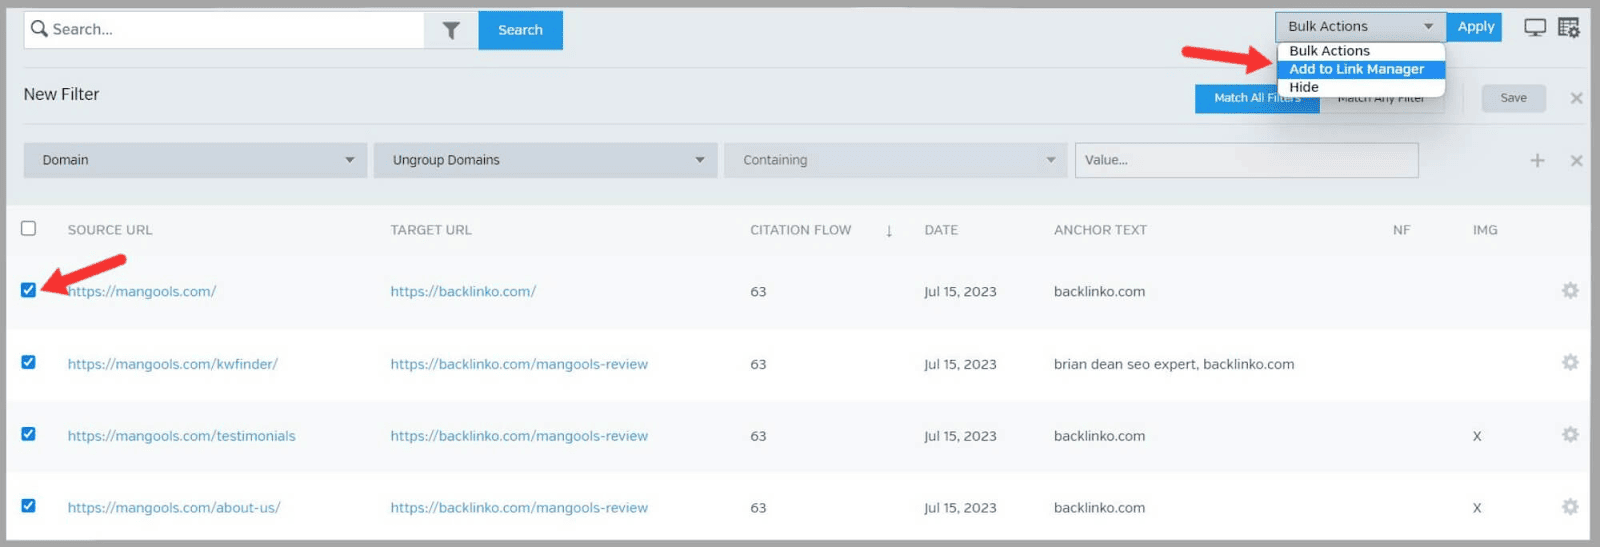
It’s that easy.
Link Manager
Once you’ve added your links, you can go into the Link Manager tool to get them nice and organized.
You can add:
- A status
- A link type
- A website type
- A link owner
- A link currency
To do this, click on the link you want to edit.
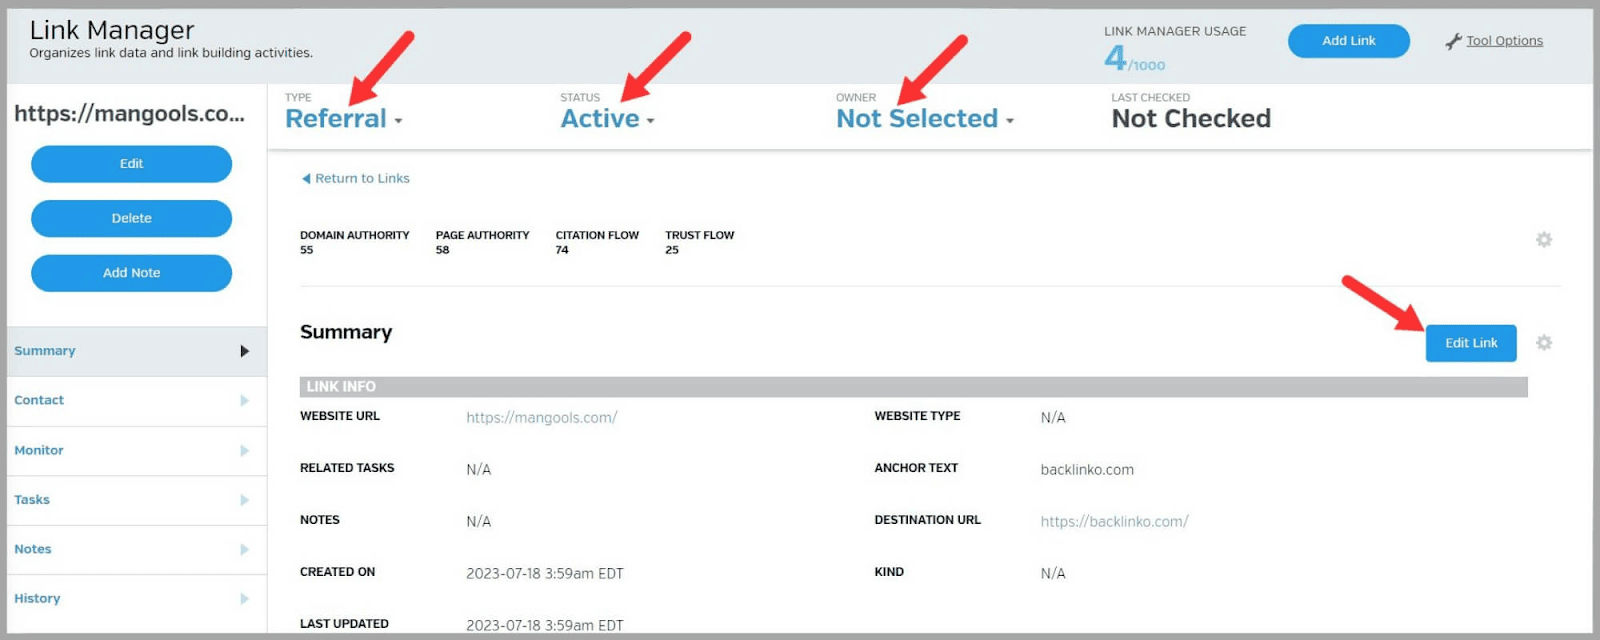
At the top of the page you can change the:
- Type—classifies the links based on certain criteria and characteristics such as whether the link comes from an affiliate site
- Status—what state the link is in such as active or inactive
- Owner—which member of your team is managing these links
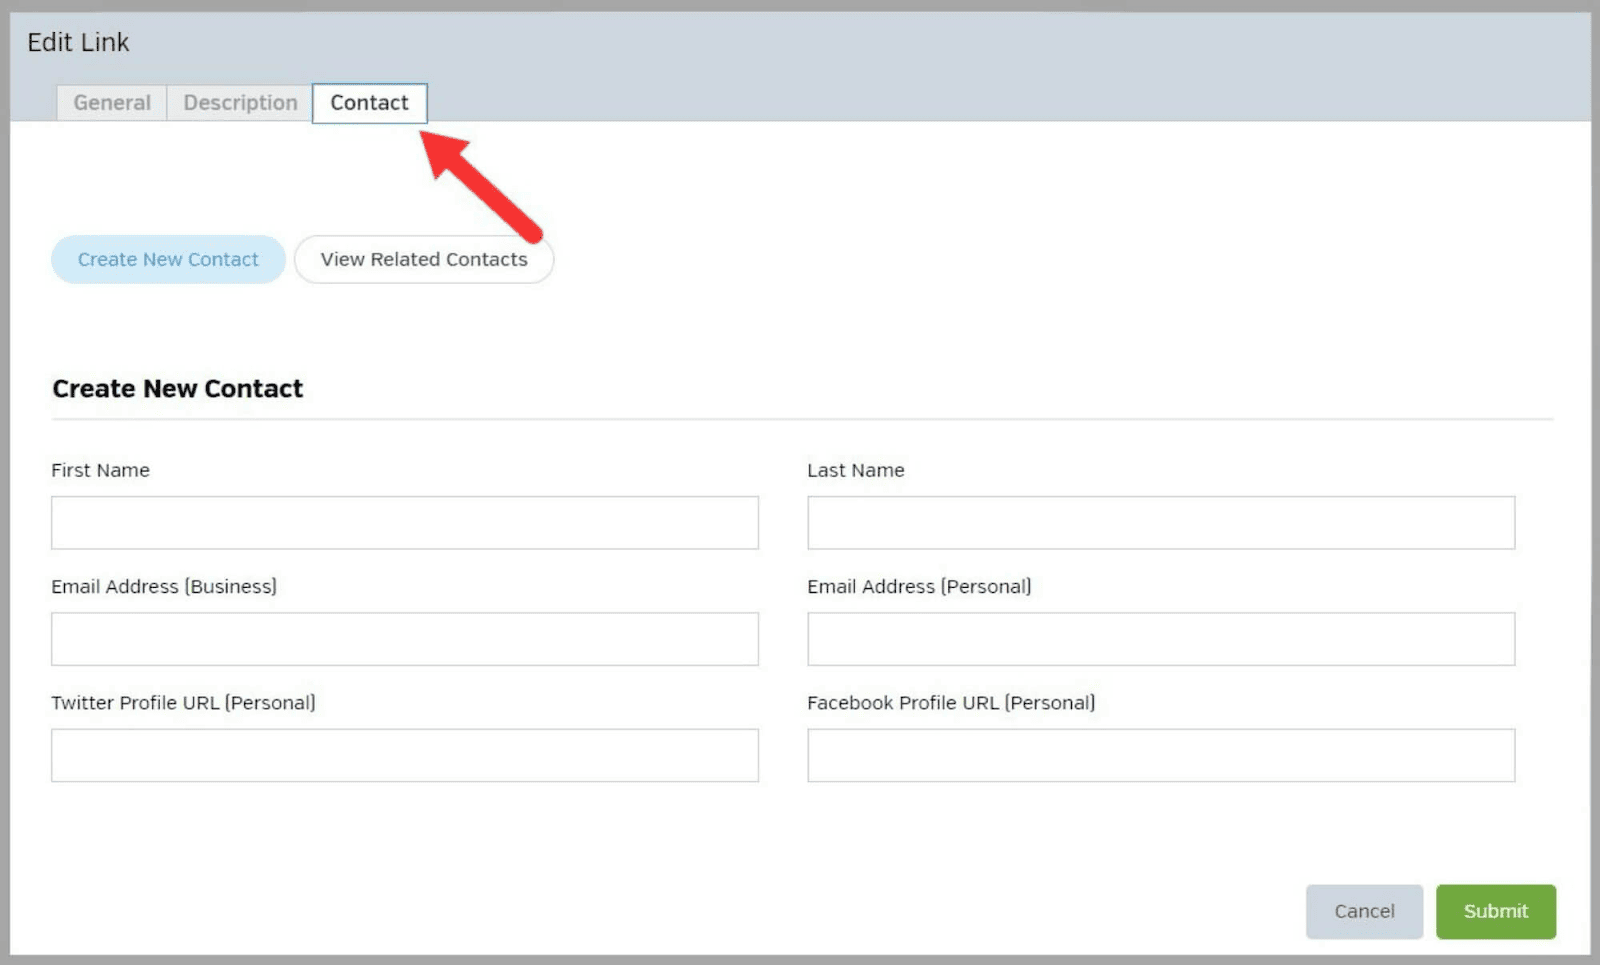
To make more changes, click the “Edit Link” button.
Then, you can add contact details and notes.
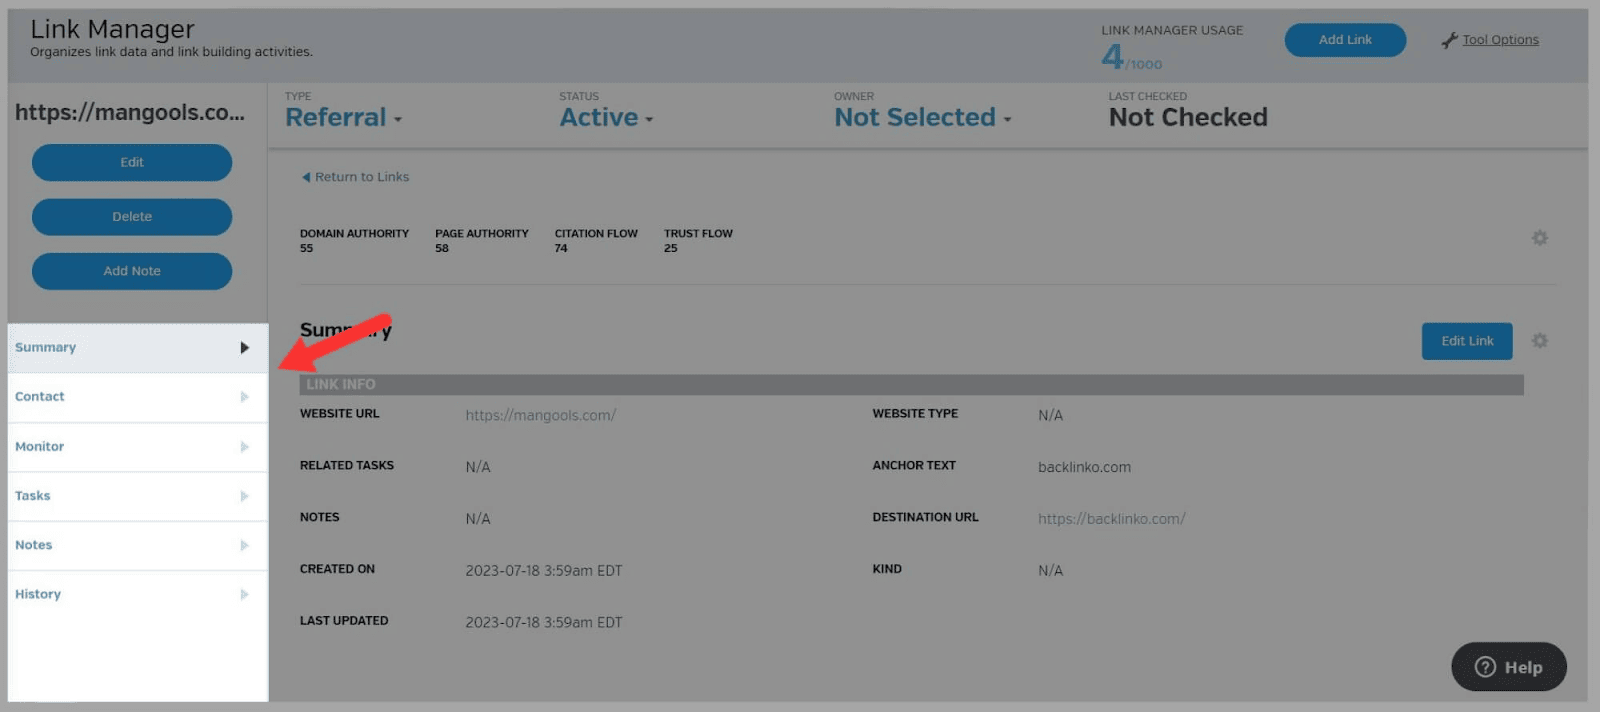
On the left side of the page, there are tabs where you can view the info you’ve added.
These are:
- Contact
- Monitor
- Tasks
- Notes
- History
If you click the “Monitor” tab then you can set up link monitoring for individual links by clicking “Check Link Status.”
You’ll then see info like “Anchor [Link] Text Match” and “URL Match.”
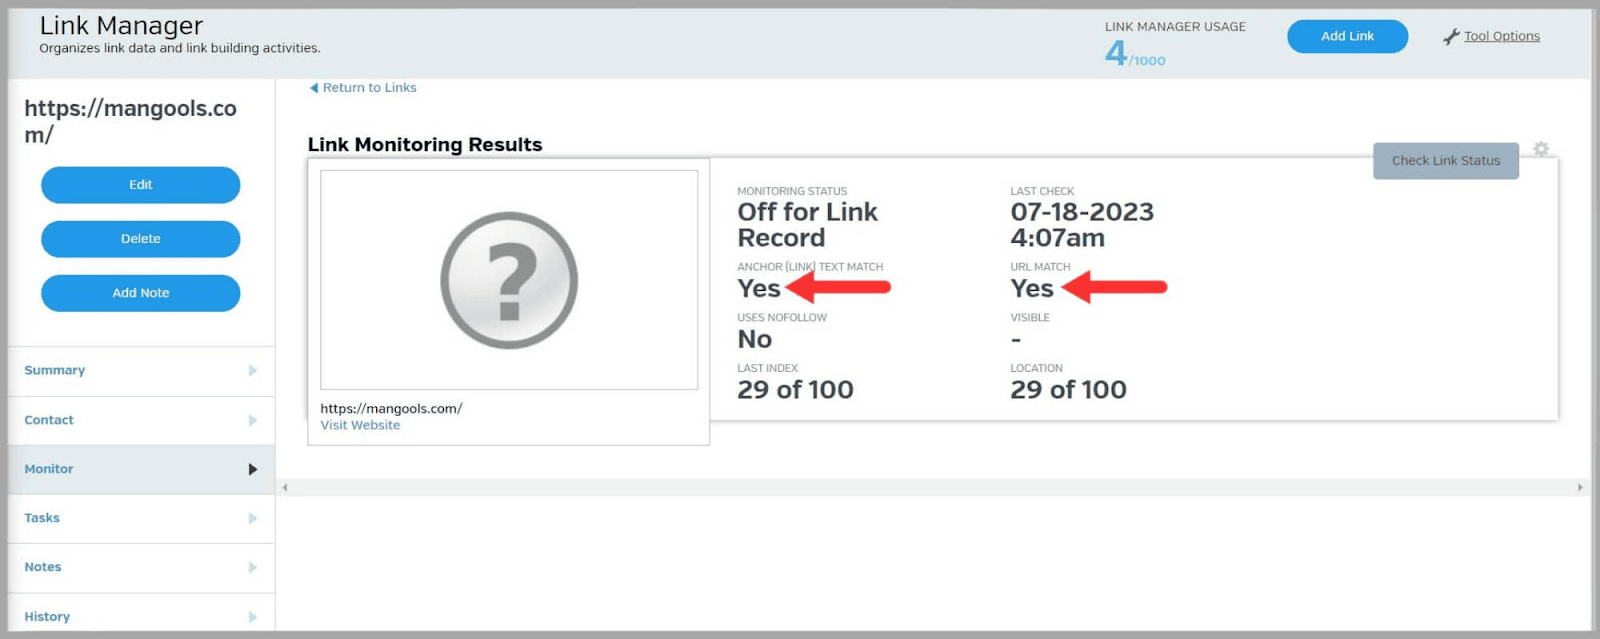
The “Anchor [Link] Text Match” tells you if the link’s anchor text matches the context of the page it’s linking to.
If the answer is no, then you should change the anchor text.
Relevance is important to both search engines and users.
By making sure your anchor text is relevant, you improve the user experience and provide more context for search engines about the page you’re linking to.
The Link Manager tool is also particularly useful if you need to create marketing reports for clients.
It helps you to keep records of acquired links and makes team collaboration easier as you can leave notes for your colleagues.
Link Spy
The Link Spy feature allows you to discover high-quality backlinks by analyzing websites that are already ranking for your focus keywords.
To use the tool, enter a keyword or phrase and hit “Find.”
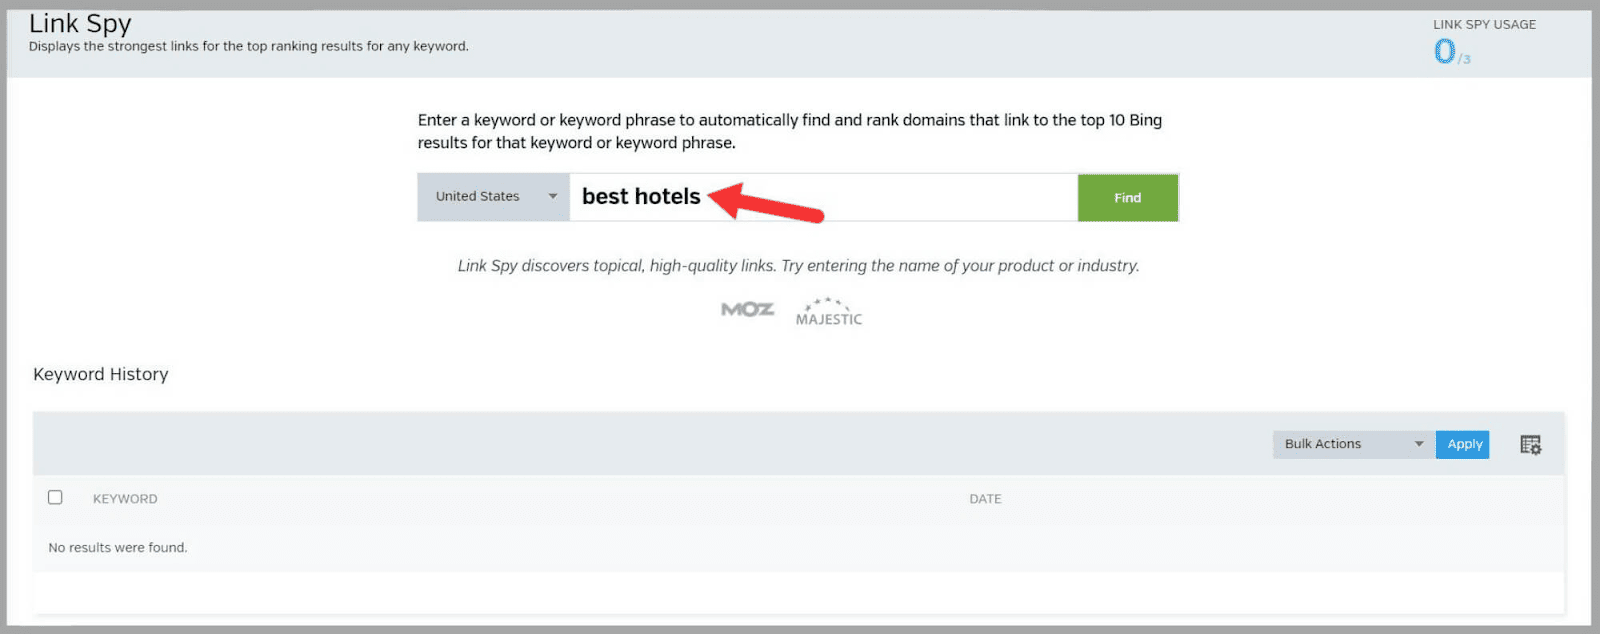
Then, you’ll see a list of domains. You can either add to this list or click “Run”.
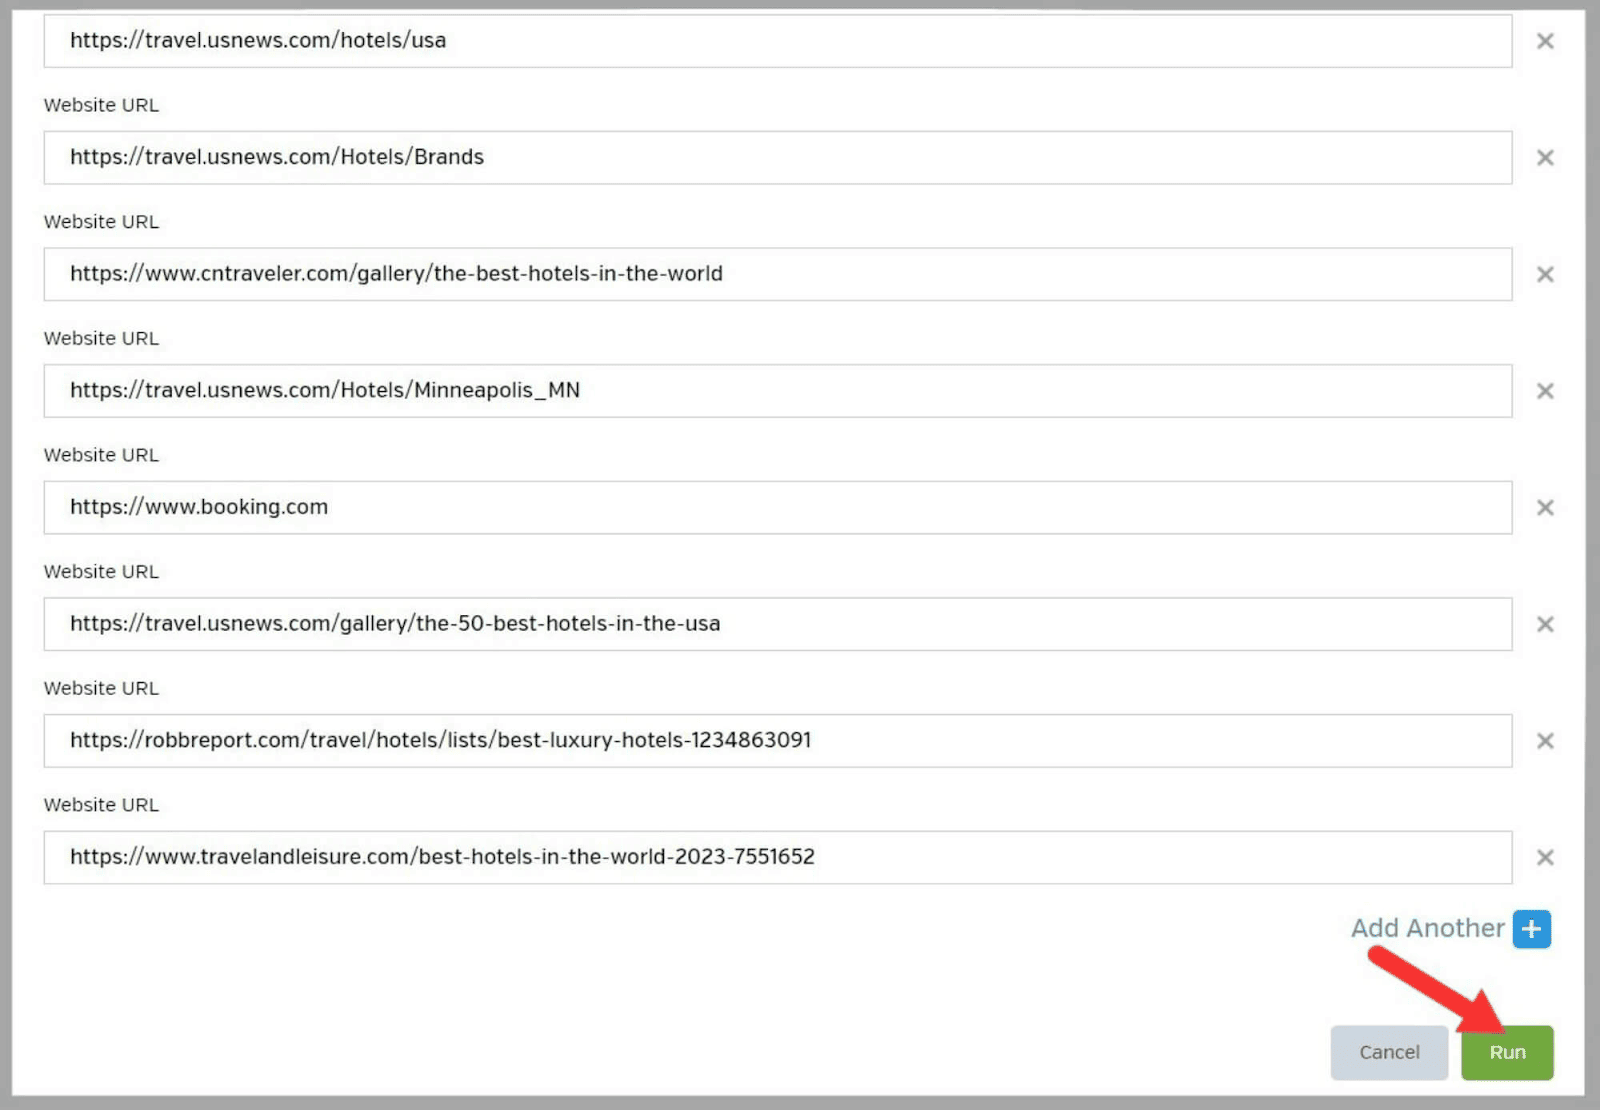
Link Spy then finds and ranks domains that have links pointing to the top 10 results on Bing for that keyword or phrase.
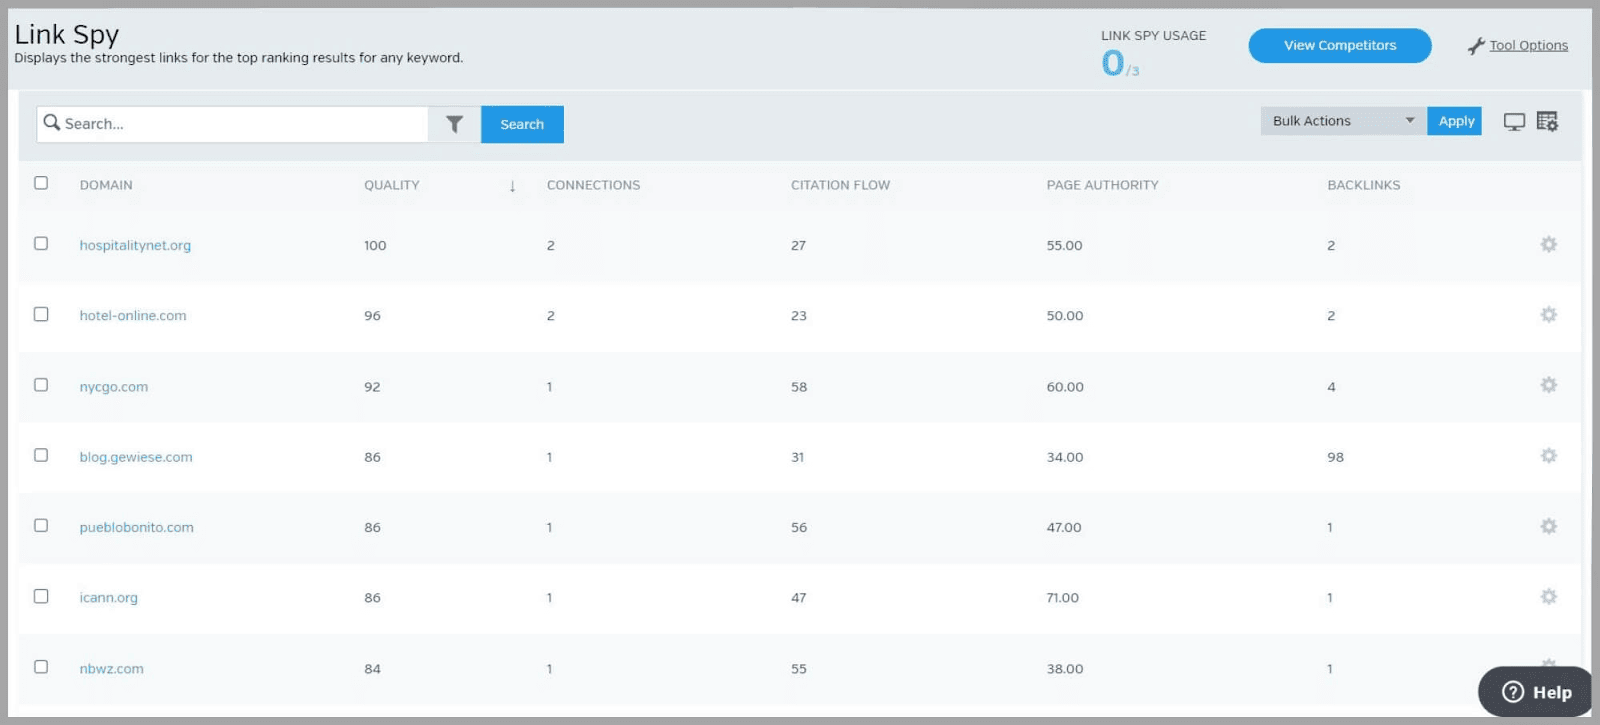
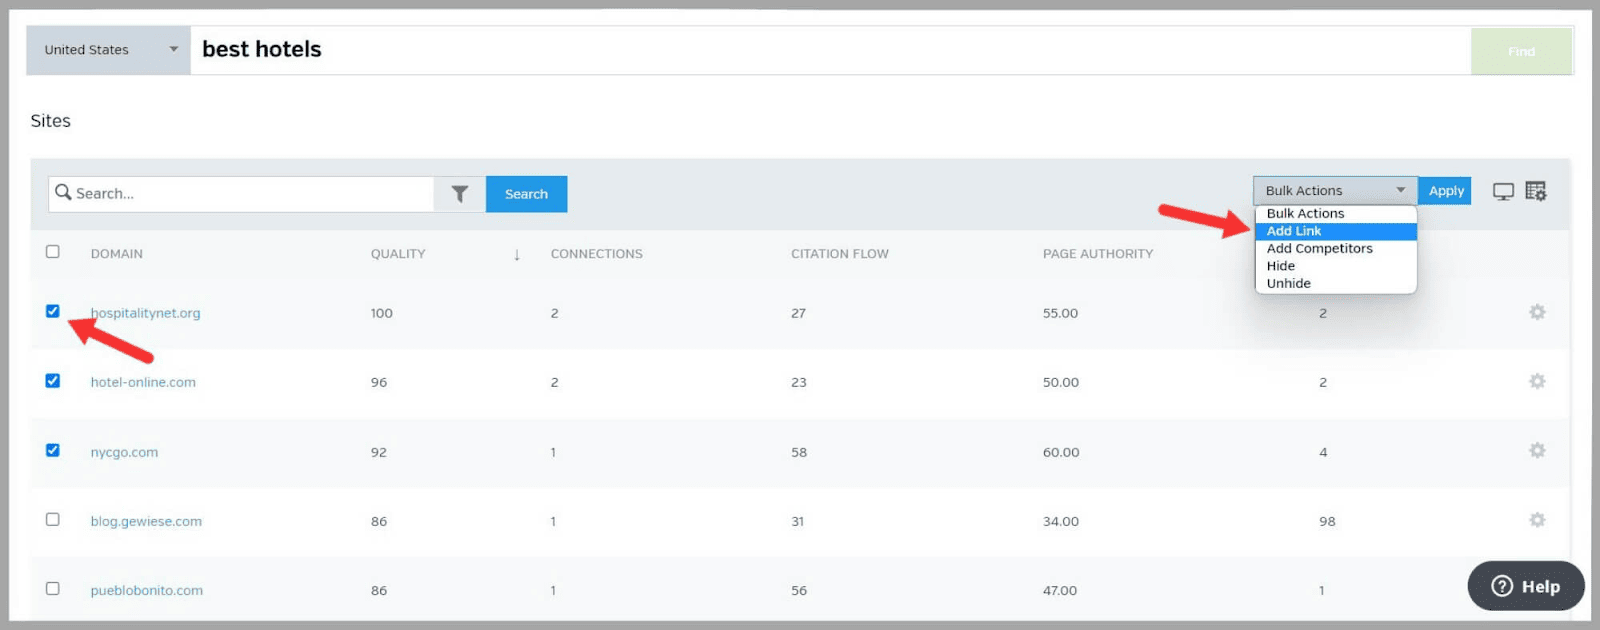
You can add domains that you want to acquire links from to the Link Manager by selecting the links and then clicking “Add Link”.
By seeing which domains are linking to the top-ranking pages on Bing for your keyword, you can identify potential backlink opportunities.
Website Directory
The Website Directory feature stores data about the domains that are saved in the Link Manager.
This data includes:
- Quality Score
- Active Links
- Paid Links
- Total Pages
- Total Links
- Page Authority
- Domain Authority
- Domain Creation
- When the domain expires
- When it was last updated
To view the various data points about a domain click “View Website Record” on the right side of the page.
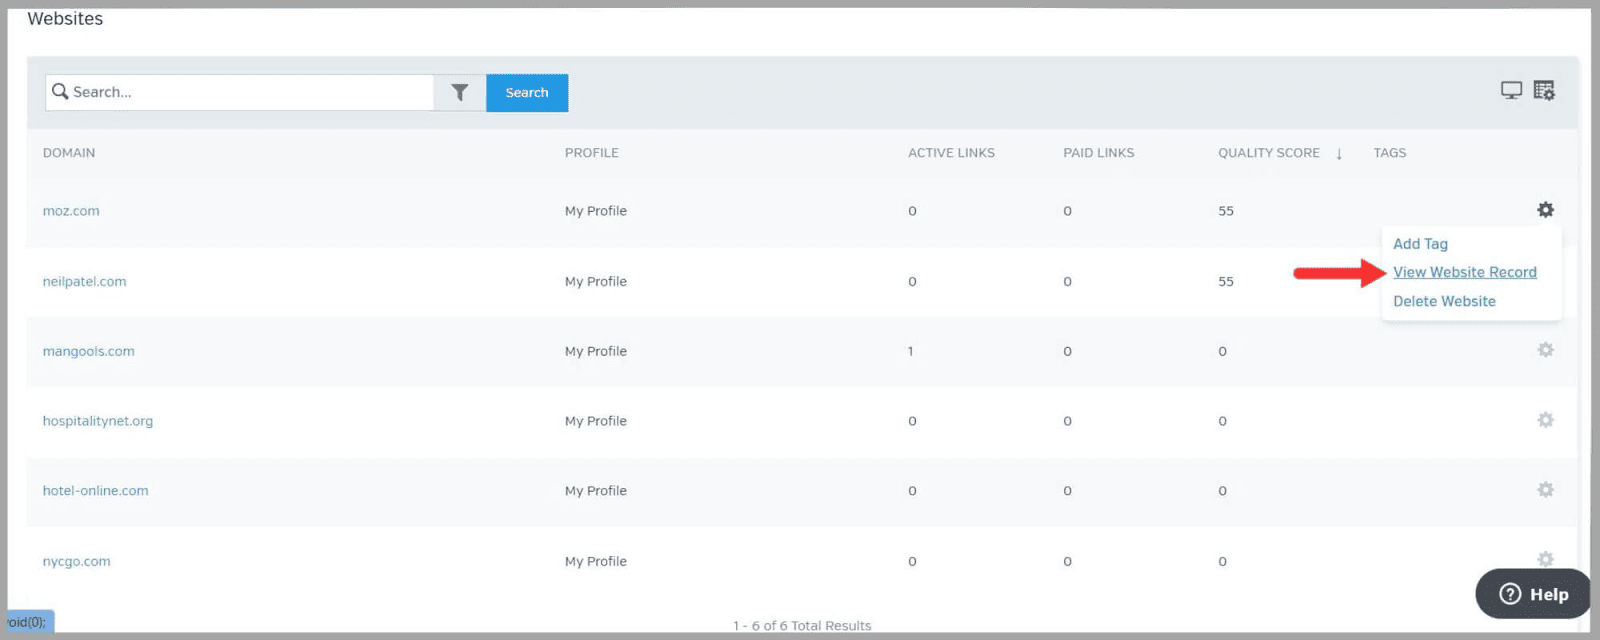
You can also add tags and notes to help keep your lists organized into groups.

If you scroll down, you see a graph representing the site’s backlink profile.
You can view graphs for:
- Total Links
- Image Links
- NoFollows
- Crawled Pages
- Referring Domains
- Domain URLs

Having access to data like your competitors’ “Page Authority” and “Domain Authority” scores helps you assess the quality and authority of the domains.
Backlinks from sites with high PA and DA scores are generally considered to be high quality.
You may want to reach out to these domains and ask for a link. You should only do this if you have high-quality content that’s relevant to the domains you want to get links from.
You could also target the sites that these domains are building links with, as long as those sites are relevant to your niche and the topics you’re writing about.
Competitor Research
You can use this tool to analyze the performance of your competitors’ sites. It allows you to view loads of useful metrics about their sites and store your data for more in-depth analysis.
Site Performance
The Site Performance section of the Competitor Research tool allows you to compare your site to your competitors.
It’s split into three categories:
- SEO Metrics
- Site Metrics
- Social Metrics
To use the “Site Metrics” table, select your competitors.
The table then shows you how well your site is optimized compared to your competitors’ sites.

If you click the “i” symbol, you’ll get some suggestions about how to improve these metrics.

For example, to improve your “Citation Flow” score the tool suggests building more inbound links from high quality authority sites. This helps to improve the authority of your domain.
“Site Metrics” tell you how well your site is performing in terms of “Load Time” and “Page Speed.”

These are vital for the user experience. If your pages take ages to load then users are more likely to bounce off these pages.
This could increase your bounce rates, and trust me, having high bounce rates is not a good thing. Google uses various user experience signals to assess a page, and bounce rate is one of them.
As with the “SEO Metrics” table, you can get some good advice by clicking the “i” symbol next to a metric.

This is one of my favorite features that Raven Tools has to offer.
I REALLY like the fact that it gives you actionable tips on how to improve your site’s performance.
Competitor Manager
Competitor Manager is one of the more basic features that Raven Tools offers.
It stores your competitors’ domains and gives you some data about them such as:
- Authority
- Number of pages on the site
- The total number of links
By comparing your domain authority with competing domains you can assess your site’s credibility and influence within your niche.
The number of pages on the site will give you insights into how big the site is.
The total number of links your competitors have is good to know about, but that doesn’t tell you the whole story in terms of the quality of the links. Quality always trumps quantity. Therefore, you’d need to perform a backlink audit to get a better understanding of the links they have.
Moving on.
When you open the tool, you’ll see a list of your competitors’ domains.

If you want to save more competitors then click “Add Competitors”, type in the domains, and hit “Add.” You can also add tags to put your competitors into different groups.
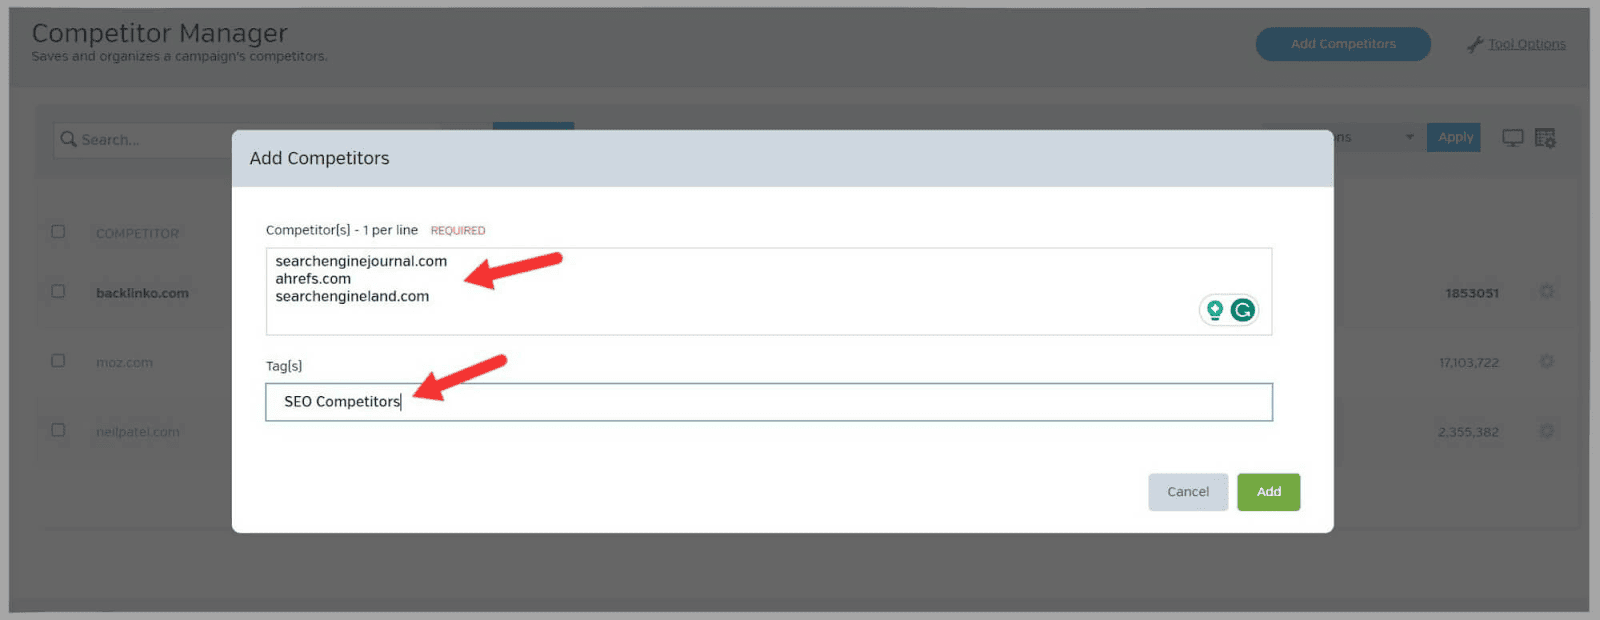
If you want to compare these competitors to each other and your own site, then choose the “Compare in Research Central” option at the top right.
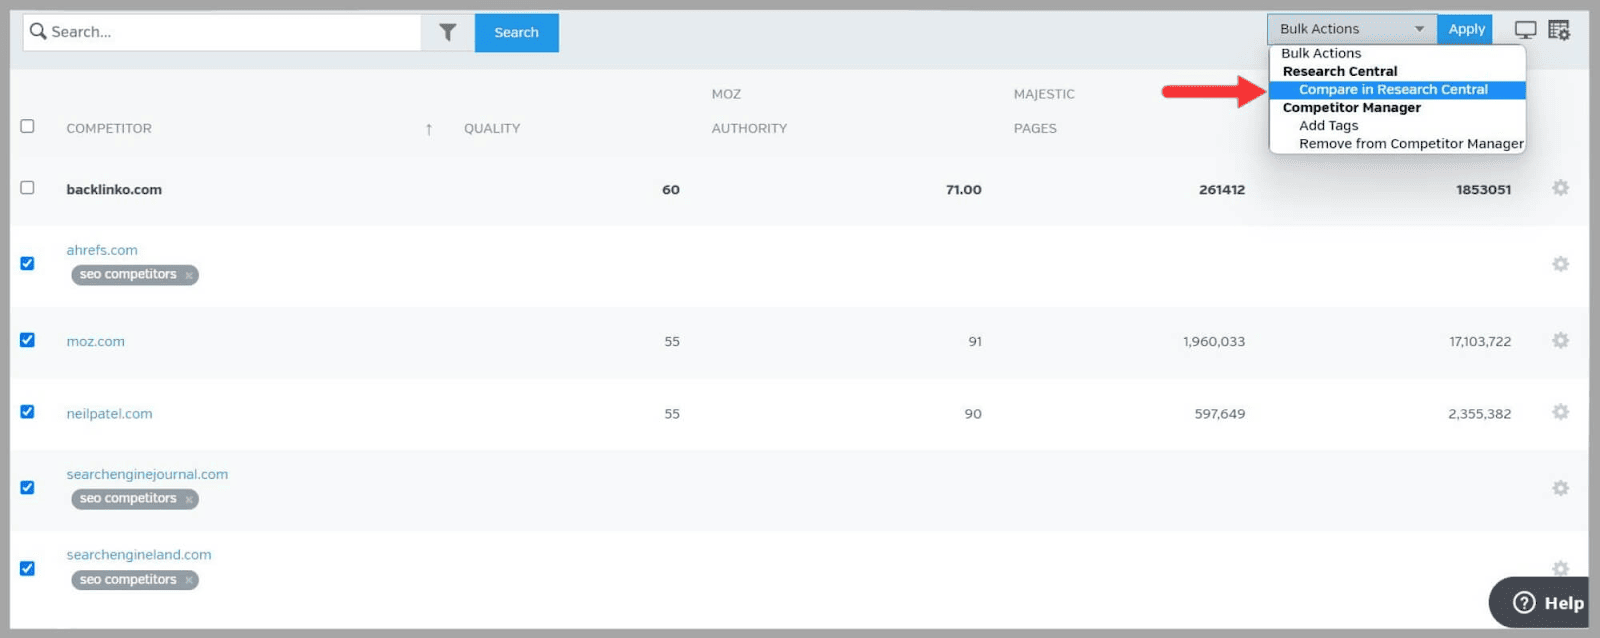
This tool is mostly used for organizing your lists of competitors so that you can analyze them with the Domain Research Central feature.
Let’s take a look at that now.
Domain Research Central
When you open the Domain Research Central feature there are nine different tabs on the left side of the page.
These are:
- Summary: gives you in-depth data on your domain and your competitors’ domains
- Quality: gives you insights into the quality of your or your competitors’ domains with metrics such as “Domain Authority” and “Page Authority”
- Keywords: provides insightful data about the keywords your competitors are targeting
- Pages: gives you metrics such as “Page Authority” and “Linking Root Domains” about your or your competitors’ pages
- Backlinks: helps you to analyze your backlink profile or the profiles of your competitors
- Neighborhood: shows you the relative location of domains to your site
- Compare: allows you to make metric comparisons between domains
- Semantic: this feature uses IBM Watson technology and analyzes your competitors’ sites for semantic information such as semantically related keywords
- Design: gives you insight into the content and semantic structure of your web pages. It also analyzes your pages HTML and informs you of any issues that might be present
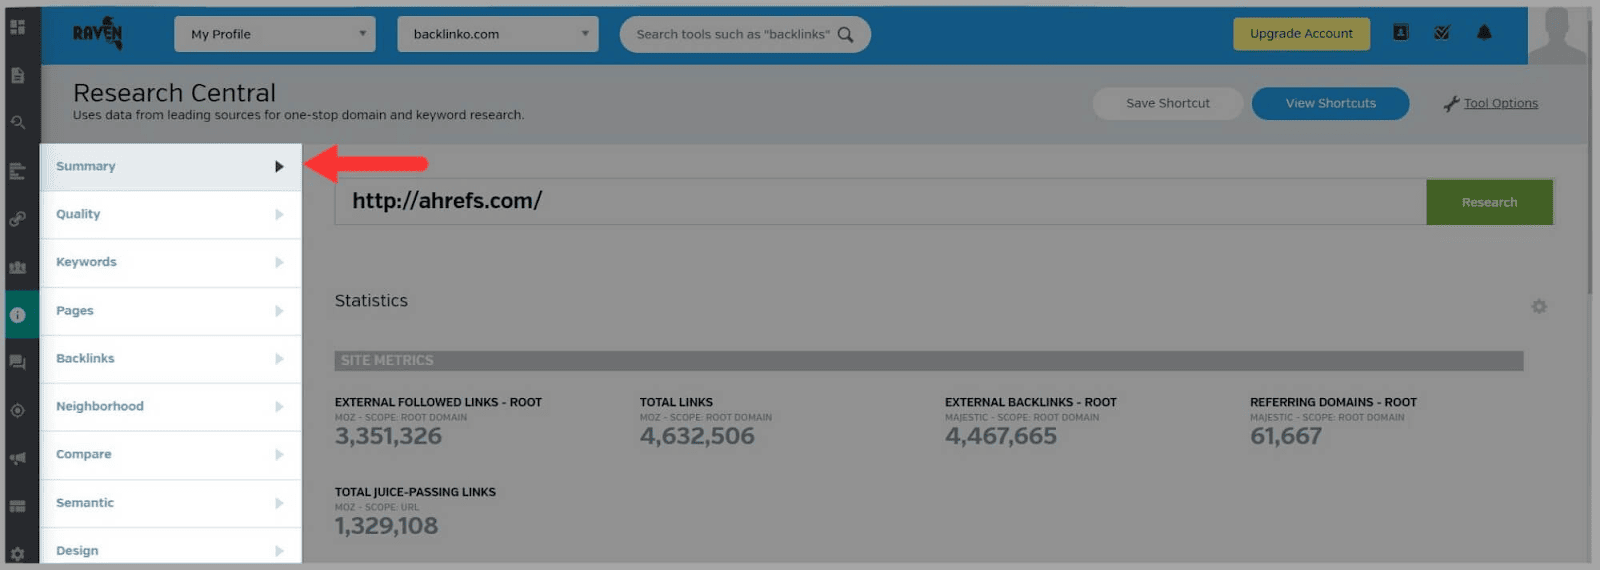
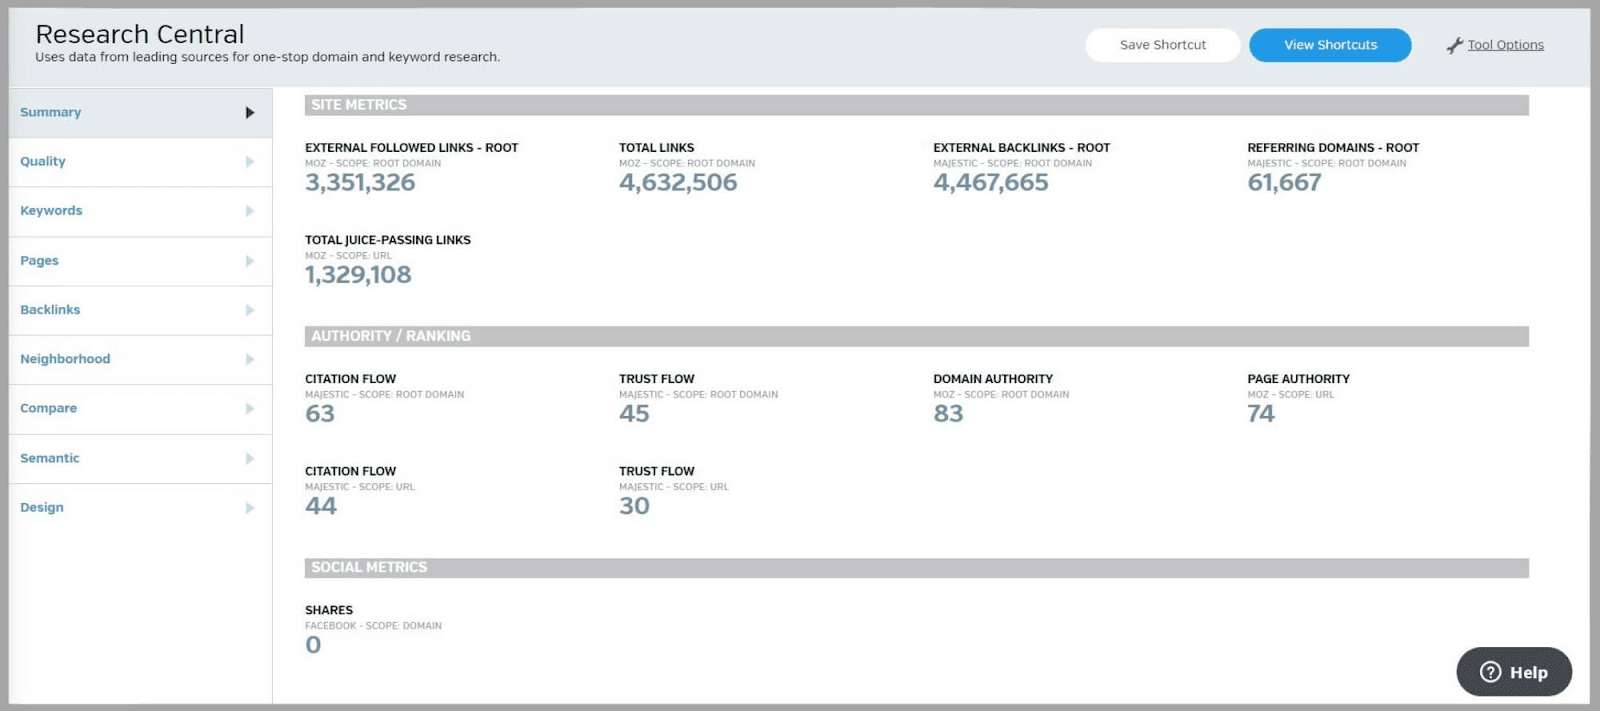
When you click on the “Summary” tab it loads up one of your saved competitors automatically.
It then gives you the following metrics:
- Domain Authority
- Page Authority
- Citation Flow
- Total Links
And these, which I’ll explain briefly:
- External Followed Links – Root: the number of “Dofollow” links from sites that point to the homepage of a domain.
- External Backlinks – Root: the number of all “Dofollow” and “Nofollow links” from sites that point to a domain’s homepage
- Referring Domains – Root: the total number of Referring Domains pointing to the homepage of a site
- Total Juice-Passing Links: the total number of internal links and external links that pass authority from one page to another
- Trust Flow: a metric used to assess how trustworthy and authoritative a site is
- Shares: the number of times a link to a page has been shared on social media platforms
When you scroll down, you’ll get the following data for your competitor’s site in the form of graphs:
- Total Links
- Image Links
- NoFollows
- Crawled Pages
- Referring Domains
- Domain URLs
Here, I wanted to view the “Referring Domains.” These are the unique domains linking to a site.

The lines of the graph are color-coordinated by year. This makes it easy to compare the data from different years to see how my competitor has fared over a longer time period.
But how does this help you?
Well, you can use this data to see how many new Referring domains your competitor gained during a specific time period, and how many they’re typically gaining in a month.
You should compare this data to your own site to see how many new Referring domains you are acquiring each month. This will inform you of whether you’re keeping up with your competitors or need to up your link building game to acquire new Referring domains in order to stay competitive.
At the very bottom of the Domain Research Central page, you’ll find another graph for “Domain Link Distribution.”
This shows you the percentage of links pointing to a site from various top-level domains (TLDs).
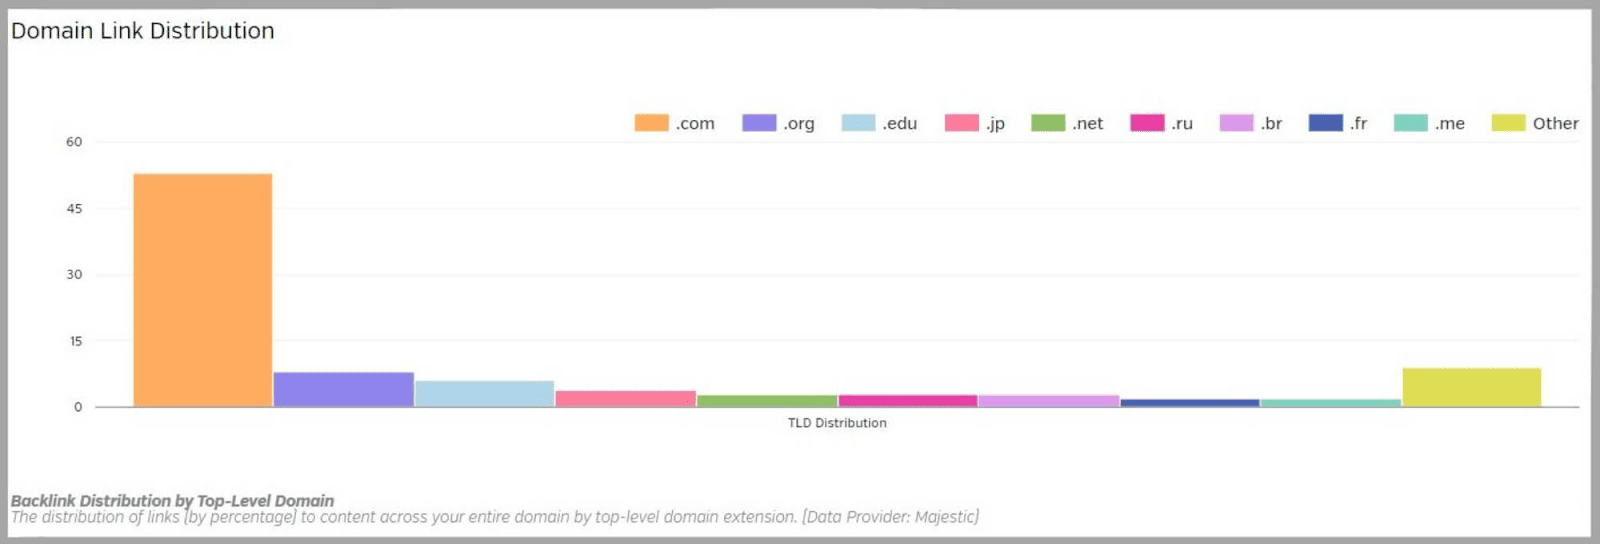
Top-level domains are the last parts of a site’s URL (.com, .edu, and .org for example).
If a site has loads of links from .edu domains then its content is clearly valuable. Links from these domains are high quality and if your competitors have some of these, then you need to amp up your link building efforts and try to acquire some for your site too.
If they have a lot of links from country-specific domains, such as .uk or .ca, then their content clearly appeals to audiences from those countries.
This data gives you a better understanding of your competitors’ target audiences.
You can use it to make sure you’re targeting similar audiences with your own content strategies.
Keyword Research
This tool is designed for finding, analyzing, and storing the keywords you want to target in your SEO and PPC campaigns. You can use it to view various keyword stats and trends to make sure you’re focusing on the most valuable terms.
Keyword Research Central
Keyword Research Central gives you lots of useful data about search terms you might want to target. The keyword data is collected from several sources including Google, Moz, Majestic, Open Calais, and Bing.
By analyzing the data you can make informed decisions as to which keywords are best to include in your SEO campaigns.
To get started, you simply enter a keyword.
I typed in “SEO Tools.”
The first thing you see is the summary page with stats like “Global Average Volume” and “Local Average Volume.”
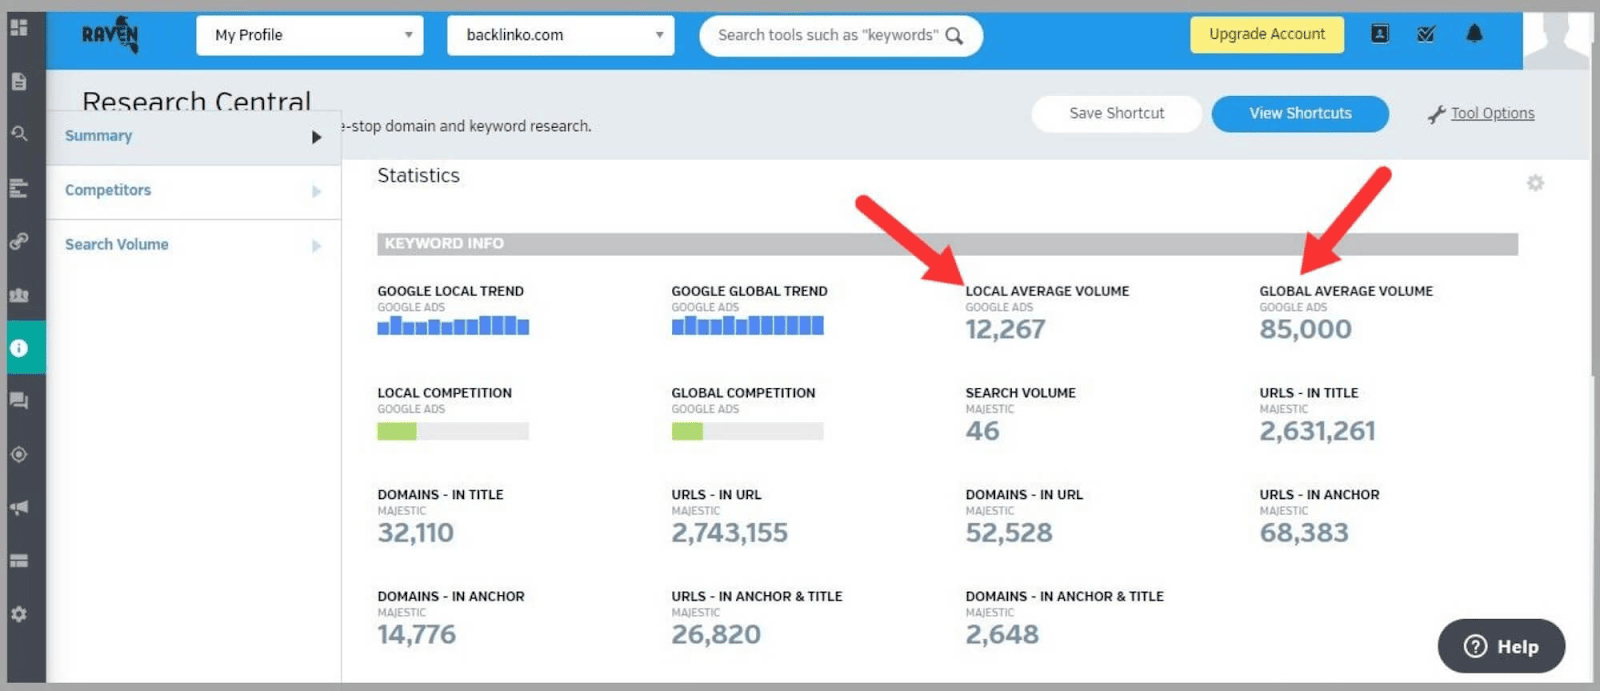
If you scroll down the page you see a nice graph for “Google Search Volume Trends.”

This allows you to see if the search term is gaining or losing interest which helps you decide whether it’s worth targeting or not.
But what if you want to see data about the competing domains that are also ranking for this keyword?
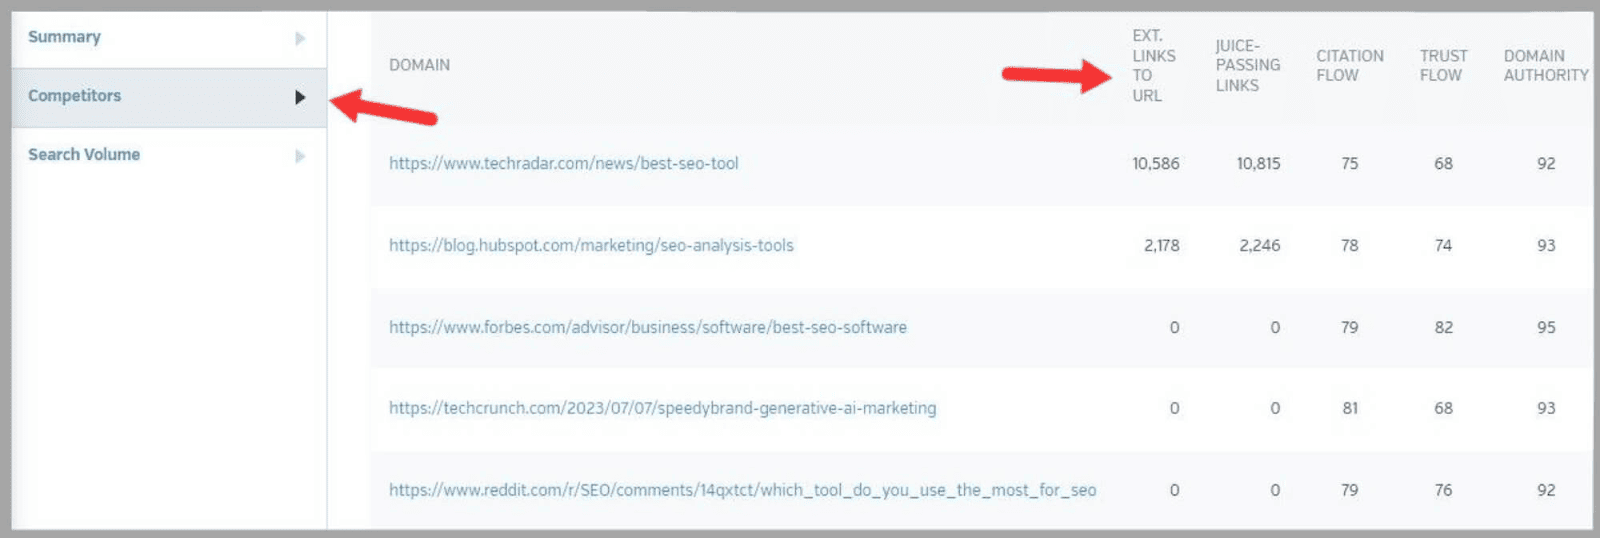
To find out, click the “Competitors” tab.
You’ll then see metrics like “External Links to URL”, “Juice-Passing Links”, and “Domain Authority.”
“External Links to URL” are backlinks from other sites that are pointing to the pages you see in the table below.
“Juice-Passing Links” are backlinks from other sites that are passing on some authority to these pages.
Now you’ll be able to get a better idea of the domains competing for the same keyword you’re targeting.
For an even closer look at your keyword, you can click on the “Search Volume” tab.
You’ll then see the search volume for the term and a bar representing the “Advertiser Difficulty.”
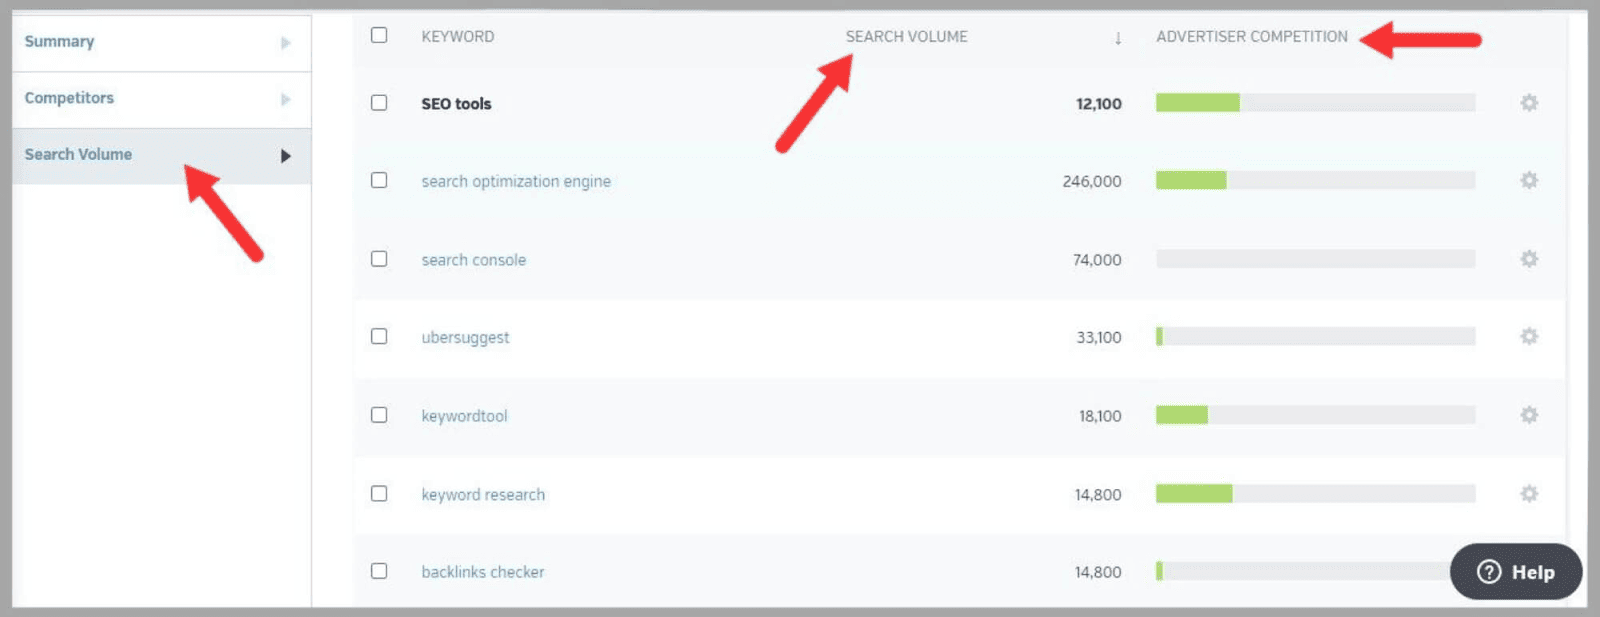
The fuller the bar, the more competition there is for the keyword in regard to PPC advertising.
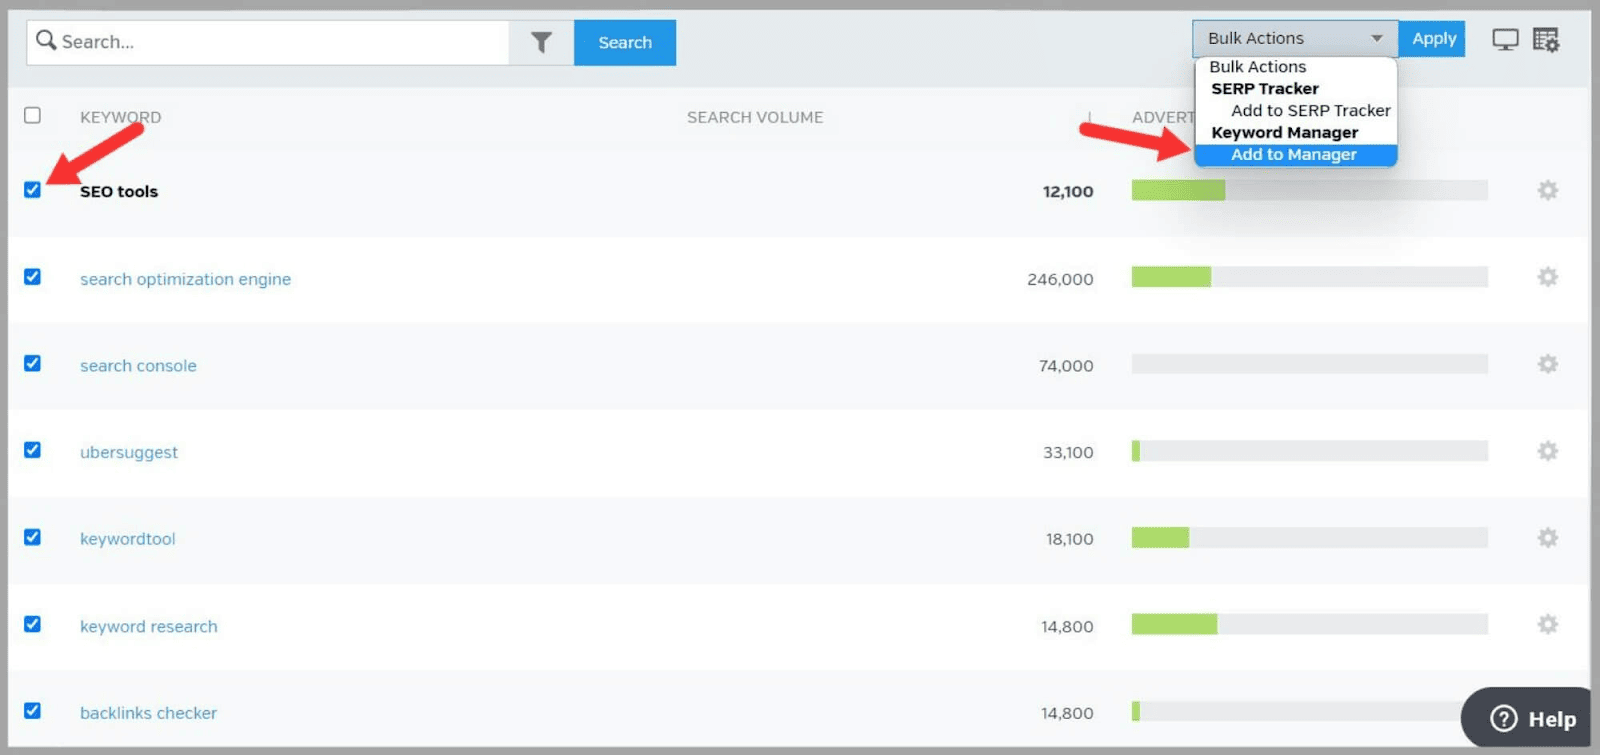
To save any keywords, just select them and click “Add to Manager.” They’ll then be added to the Keyword Manager tool.
Keyword Manager
The Keyword Manager tool is where you add and keep track of the keywords you choose to target.
You’ll probably already have some keywords that you’ve added with the Keyword Research Central feature.
But you can still add more.
Once you’re in the tool, click “Add Keywords” and then type them in.
You can also add tags to categorize your keyword groups. This makes it much easier to organize your keyword research.
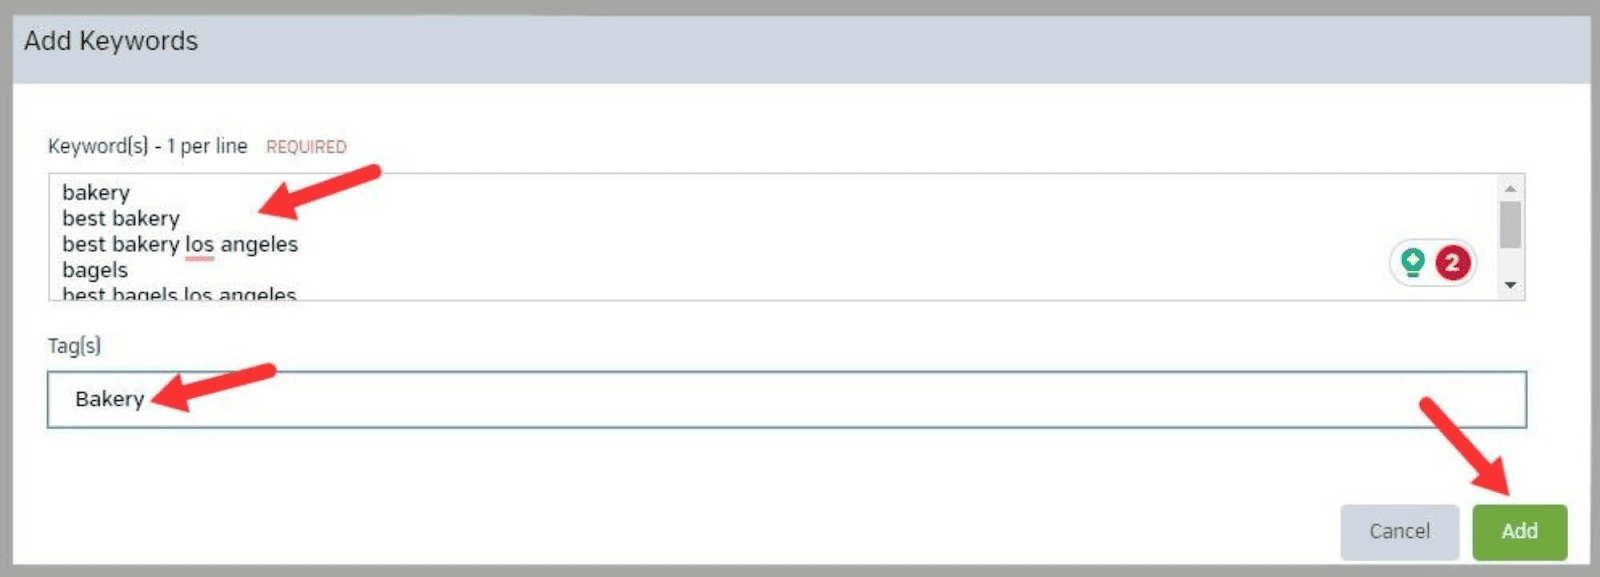
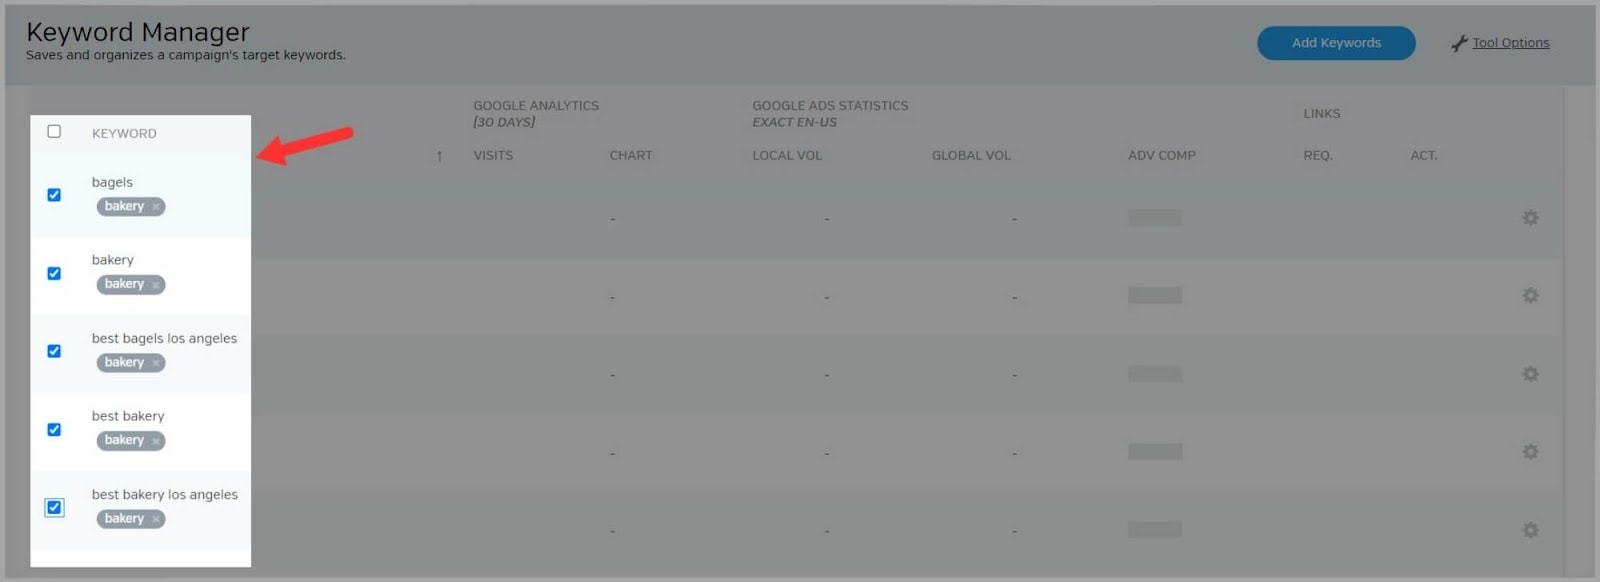
Once you’ve added your keywords they’ll be stored in the Keyword Manager for you to access any time.
If you’ve added tags, then they’ll be grouped according to the tags.
Social Media
The social media feature allows you to connect various social media accounts to Raven Tools.
This helps you to streamline your social media marketing efforts.
Once you’ve connected your Twitter account to Raven Tools, there are plenty of things you can do with this feature.
One of the best tools is the “Personas” feature. This allows you to add and track your Twitter account.
Then, you can closely monitor many aspects of your Twitter activity such as friends and followers, retweets, recent mentions, and posts.
This feature also has graphs and tables that help you keep track of how engaged your audience is with your content.
By tracking this, you can identify which types of tweets or topics resonate best with your audience and adjust your social media strategy accordingly.
By connecting your Facebook account to Raven Tools you can:
- Analyze Facebook traffic data and insights
- Create scheduled posts and edit them
You’re able to add both business and personal Facebook accounts to Raven Tools.
YouTube
You can connect multiple YouTube accounts to Raven Tools.
When you’ve done this, you can use the tool to:
- View your YouTube traffic data.
- Analyze advanced metrics for up to 10 videos.
Syncing YouTube with Raven Tools gives you access to comments, views, and favorites within one feature.
The tool uses Google Analytics data to help you see if your YouTube campaign is leading to increased traffic to your site.
By analyzing this data, you can make informed decisions about optimizing your YouTube channels to get the best results.
After you’ve connected your LinkedIn account you can:
- Interact with groups, connections, and companies
- Carry out analysis of LinkedIn metrics
- Create scheduled posts
Ads
The ads feature lets you connect your Google Ads and Bing Ads accounts to Raven Tools. This means you can keep track of your ad campaigns in one place.
Google Ads
First, add your Google Ads account to RavenTools. Then you can:
- Use the tool to track your PPC campaigns
- Easily create campaign performance reports
- Create your ads, ad groups, and campaigns within Raven Tools
Bing Ads
As with the Google Ads feature, by connecting your Bing Ads account you can keep track of the performance of your PPC campaigns.
Facebook Ads
Raven Tools gives you access to three levels of data when it comes to Facebook Ads:
- Campaign: This is the highest level where you can store all of your Facebook Ads campaigns. It has its own tab, and you can select specific campaigns to view the associated “Ad Sets” and “Ads.”
- Ad Set: “Ad Sets” represent groups of ads. Each ad set is linked to a campaign. By examining them, you can get insights into how different groups of ads perform together. You can group “Ad Sets” by criteria like agent, location, and client.
- Ad Level: This is the foundational level of data. At this level, you can access all the Facebook insight statistics for each individual ad. You can also now group ads within “Ad Sets” and campaigns. This allows for more comprehensive metrics and analysis.
Communication
This tool allows you to connect your CallRail and email accounts to Raven Tools.
CallRail
CallRail is a call tracking and analytics software. It helps you to track and analyze phone calls generated from various marketing campaigns and channels.
It’s useful for businesses as it can give you insights into the effectiveness of your marketing efforts, therefore helping them to make data-driven decisions and optimize their marketing strategies.
Once you’ve connected your account, you can monitor the performance of your CallRail campaigns.
With this feature you can connect your email accounts so you can track your metrics and campaigns within Raven Tools.
You can connect to:
- Constant Contact
- AWeber
- MailChimp
- Emma
- Campaign Monitor
Manage Content
This tool allows you to create and optimize content which you can then publish on your site. You can also sync this feature with your WordPress account and use it to order bespoke content from Textbroker.
Content Manager
Raven Tools’ content manager feature is a hub where you can store and organize your content for your campaigns.
You can either use the tool to create content or copy and paste your existing content into it.
To get started, click “Add Content.”

Then, you add an author and a title and start typing or pasting your content.
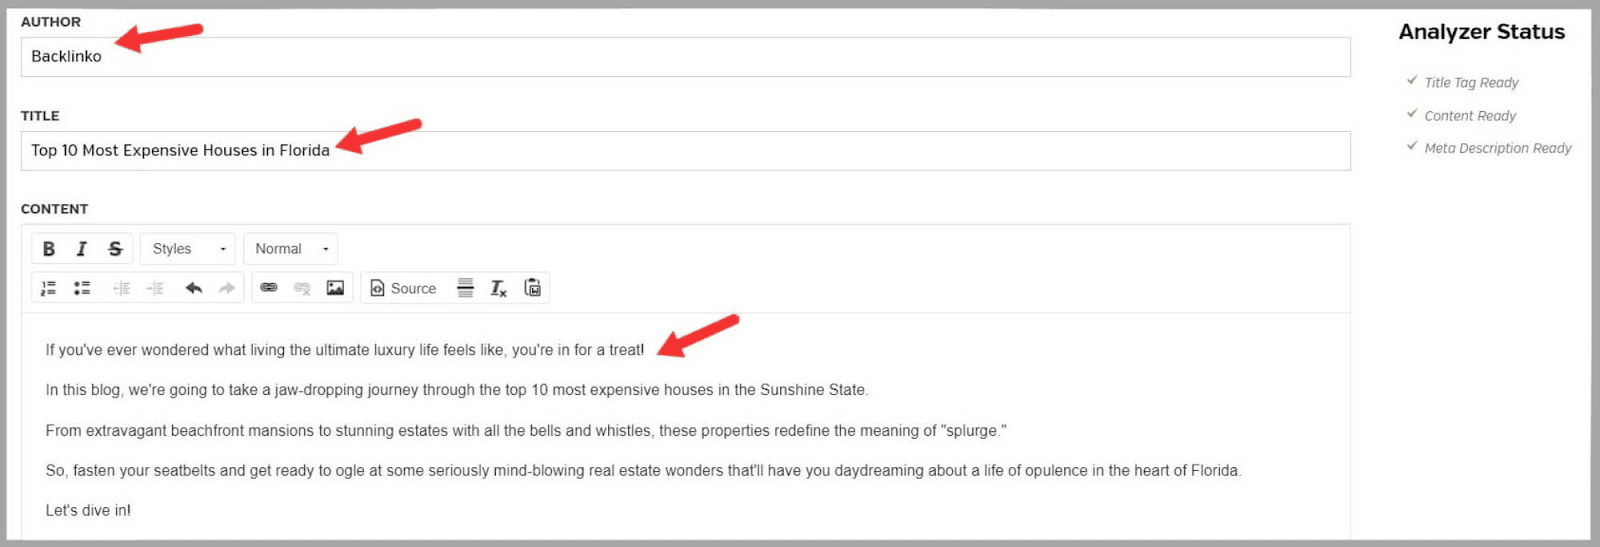
To be honest, I’d recommend writing your content first and then copying it over.
Raven Tools’ content tool is VERY basic and it can slow down the writing process quite a bit.
When you’ve written or pasted your content, you scroll down and add a meta description. The tool then gives you a preview of what that’ll look like in the SERPs.

That’s a neat little touch. Usually, you need to use a separate tool to get a SERP preview like that.
Next, you can add some tags and some keywords. This helps you group your content with other relevant articles.
Then, you click “Save.”

You’ll then see a preview of your content and you can also view it as HTML.
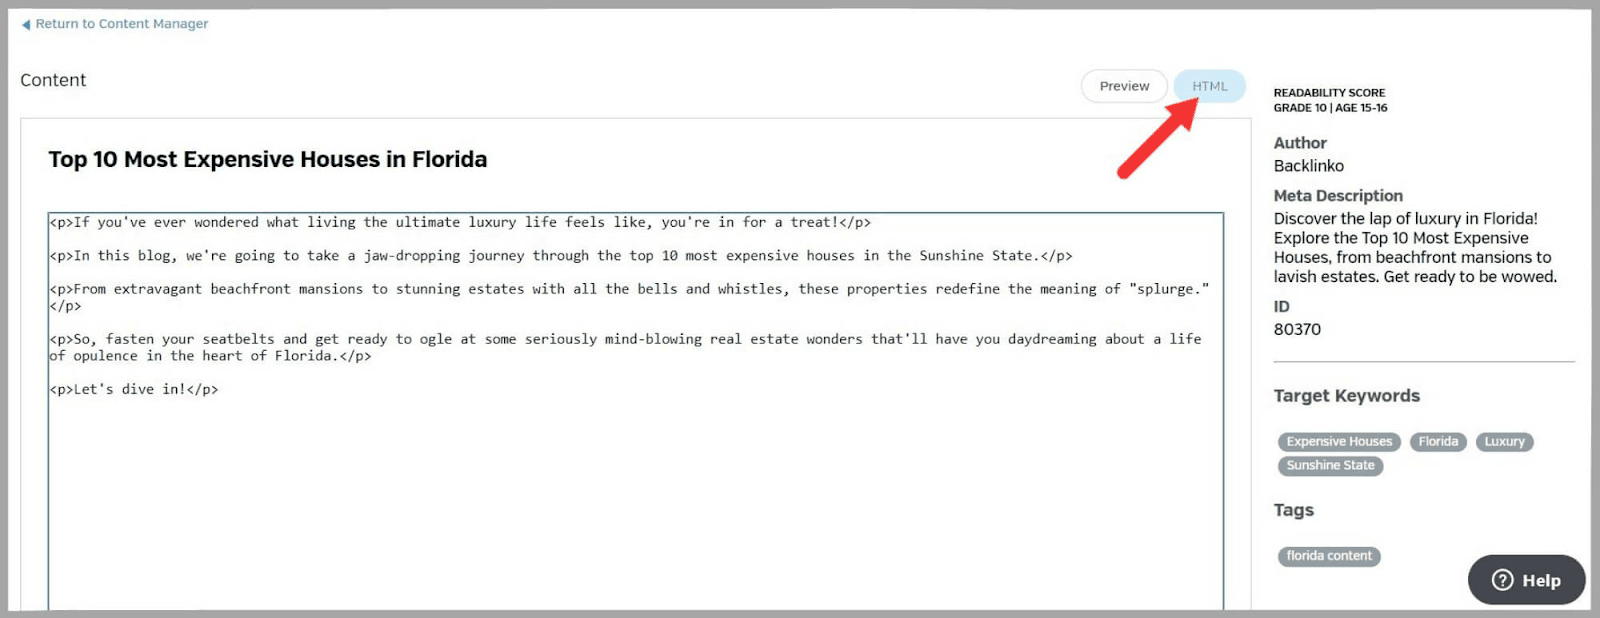
This isn’t exactly the flashiest feature that Raven Tools offers but it’s handy for keeping your content neatly grouped and organized.
WordPress
You can use this feature to publish content directly from Raven Tools to your WordPress site.
It helps you to organize your content and keep it stored in the same place.
Order Content
This feature allows you to order content from a freelance writing service called Textbroker.
This is a great way to save yourself time when it comes to content creation.
Still, you’ll need to factor the expense of Textbroker into your budget if you plan to use it.
The nice thing about this feature is that you don’t need to communicate directly with Textbroker.
You simply fill in the form that Raven Tools gives you and you’ll be given an estimated price for your content.
The form allows you to add:
- A language
- A category
- A title
- A description
- Target keywords
- Minimum and maximum word count
- The order date
WYSIWYG Reports
Raven Tools has a feature that generates WYSIWYG (What You See Is What You Get) reports.
These are reports that break down all of the data Raven Tools gathers for you into different sections.
You can use them to keep track of your site’s progress.
Or, you can present them to your clients to show them the work you’ve been doing for their domains.
To create your report, click “New Report.”
Then you can either build your own custom report by clicking “Add More Metrics” or you can use a pre-made template.
The templates are white-label reports created by Raven Tools that can then be re-branded.

I chose to build my own report.
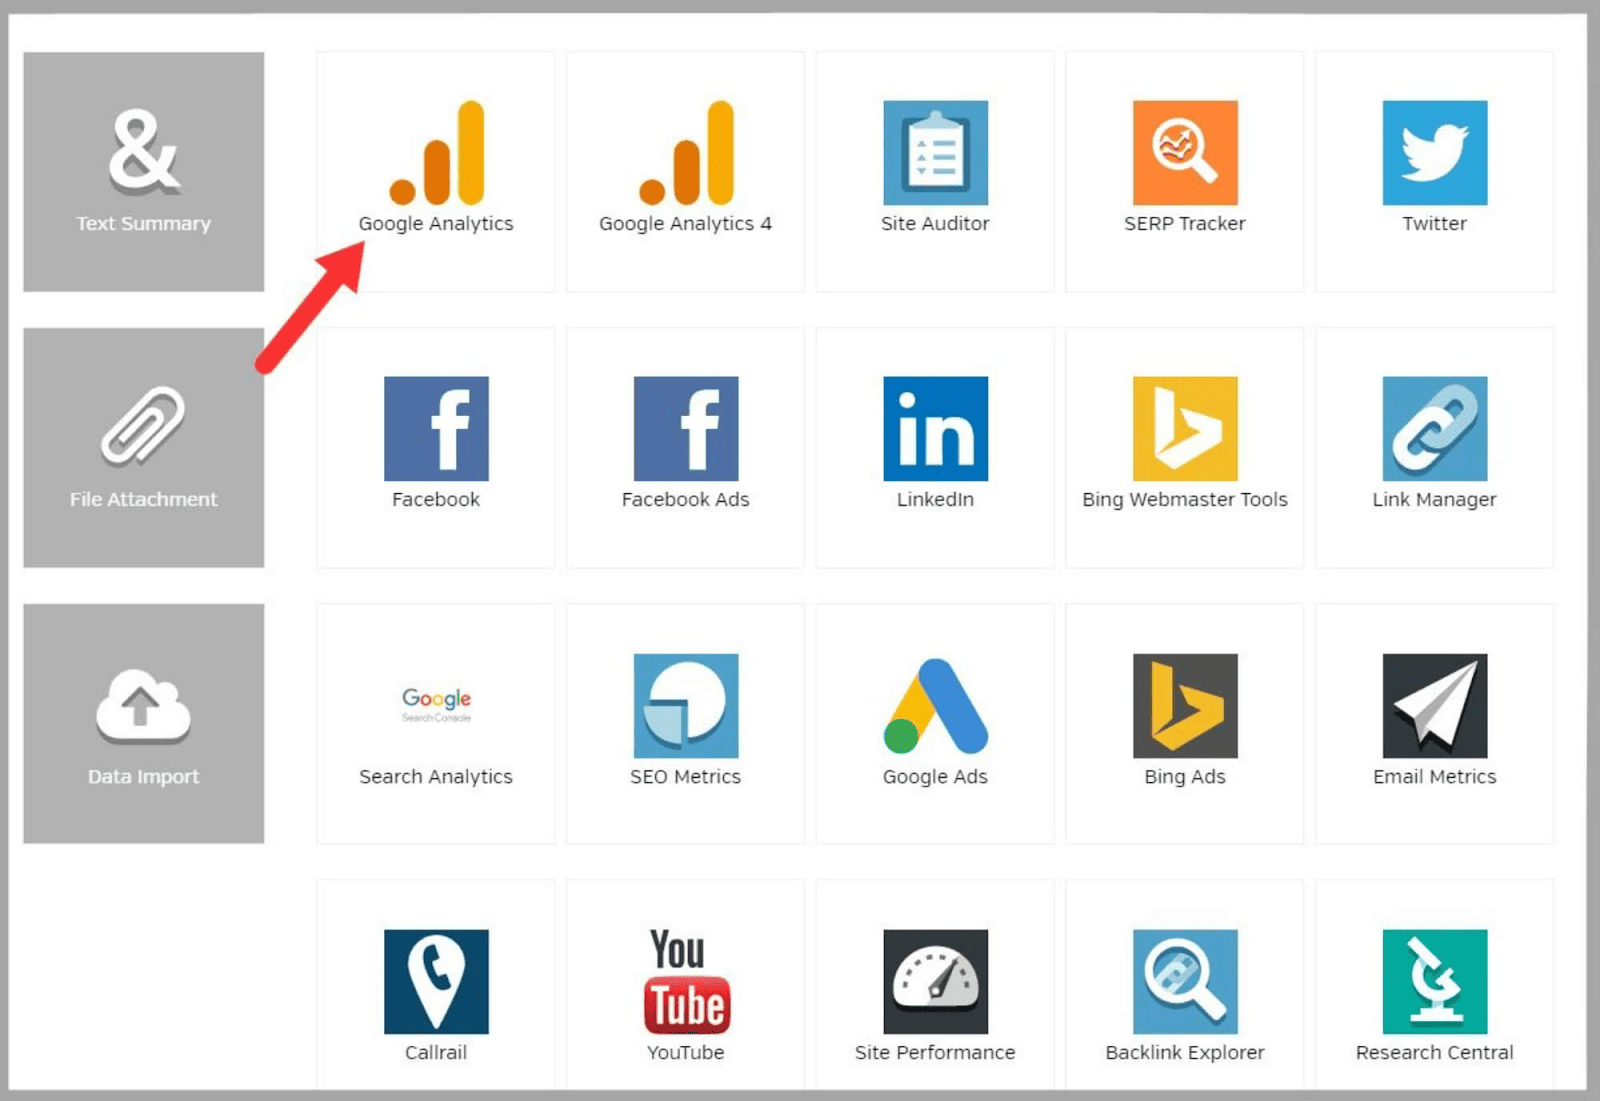
When you click, “Add More Metrics” you’ll see all the metrics you can add to your report.
I started with Google Analytics.
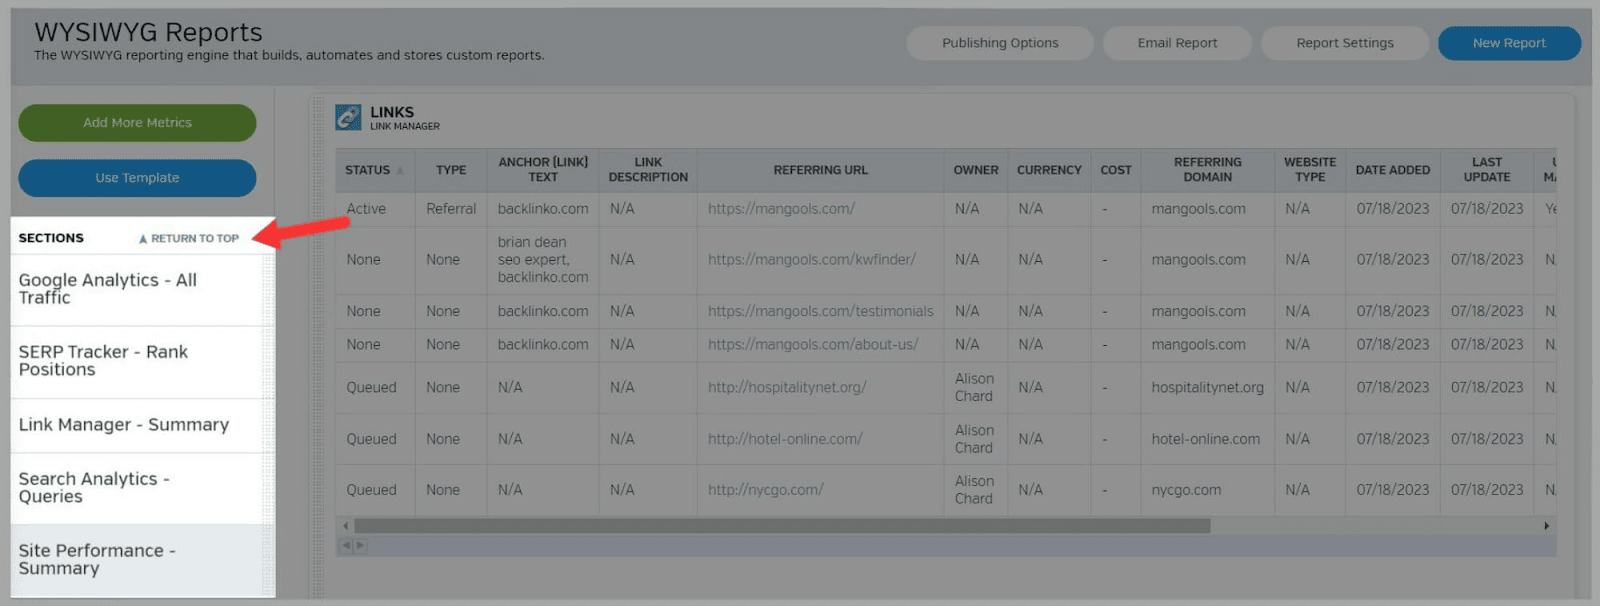
You can find the different sections of your report here.
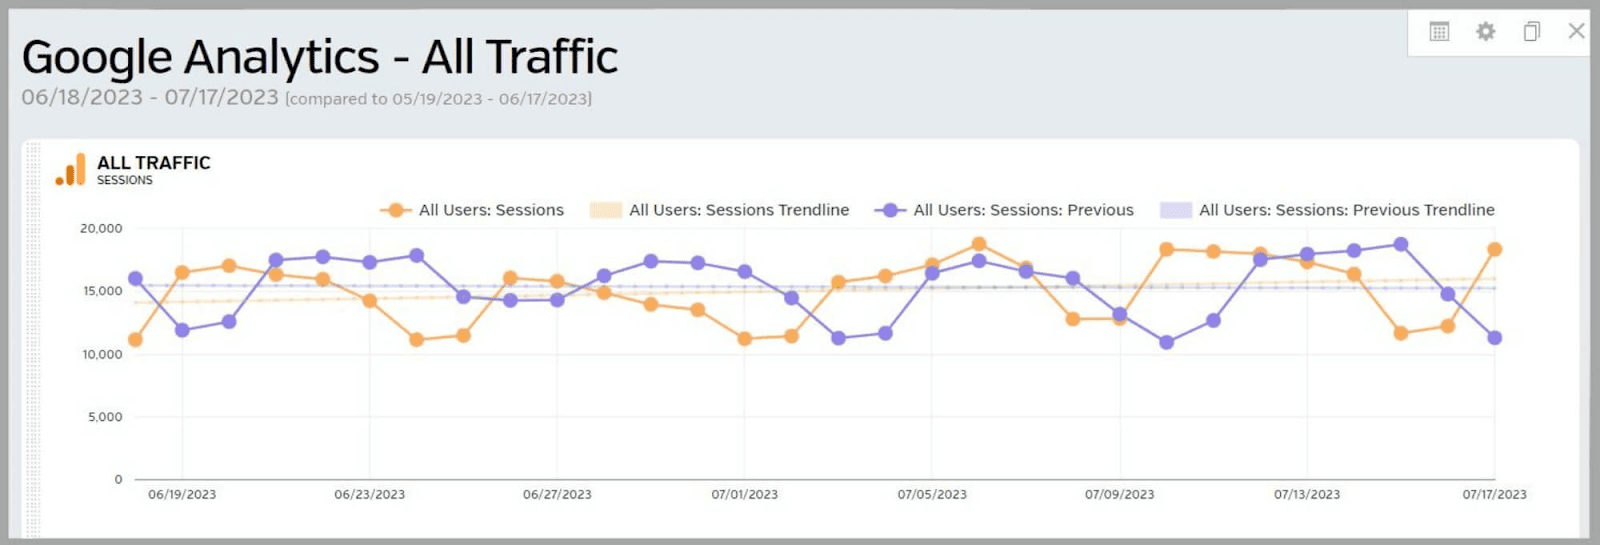
This is part of the Google Analytics section of my report.
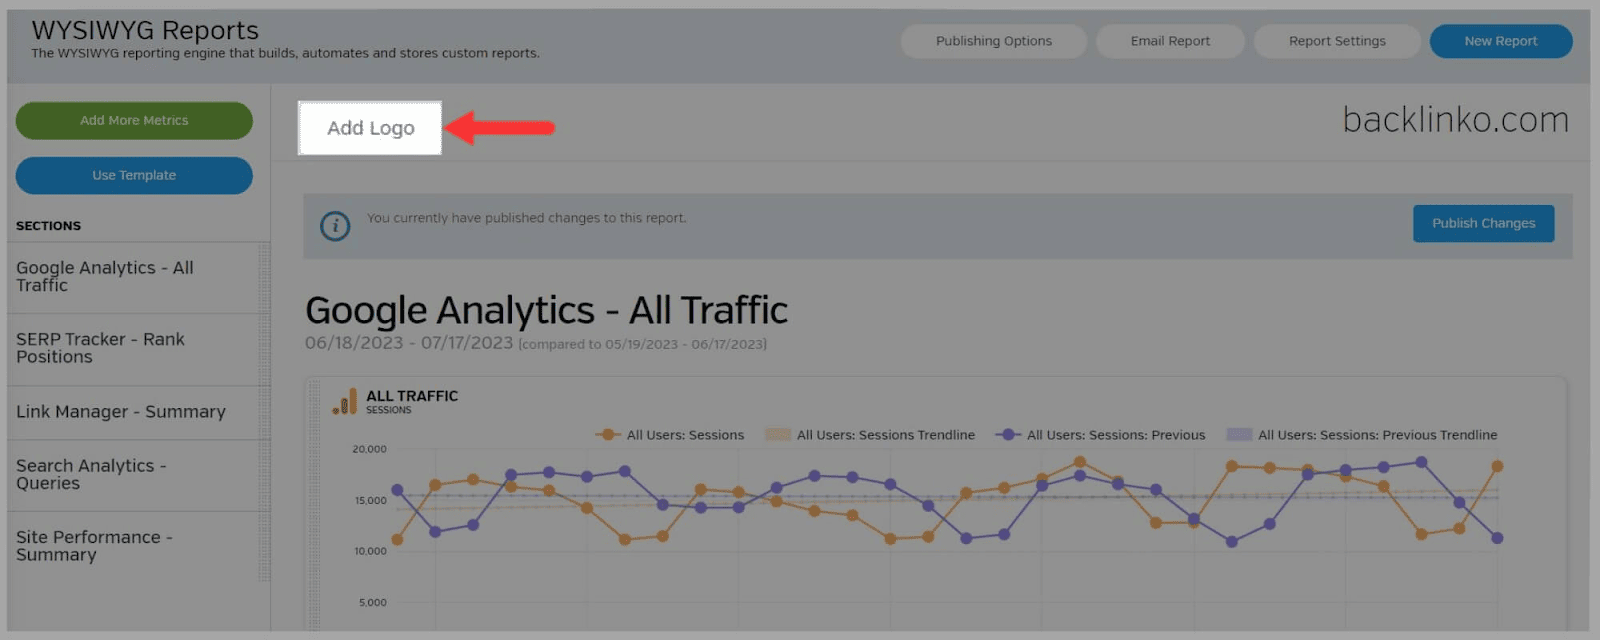
To brand your report click “Add Logo”.
If you click “Report Settings” then you can alter things like the frequency of the reports and the time period.
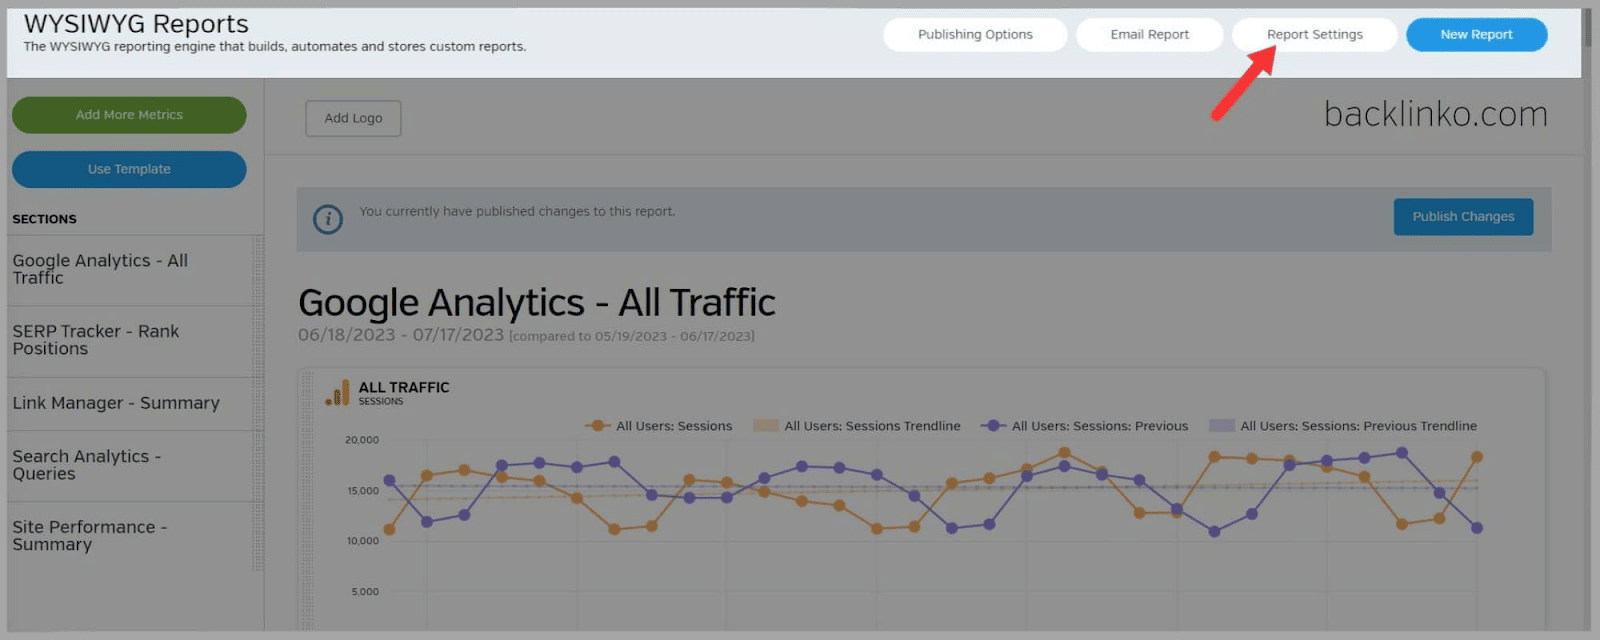
Finally, you can choose to email the report to a client or publish the report.
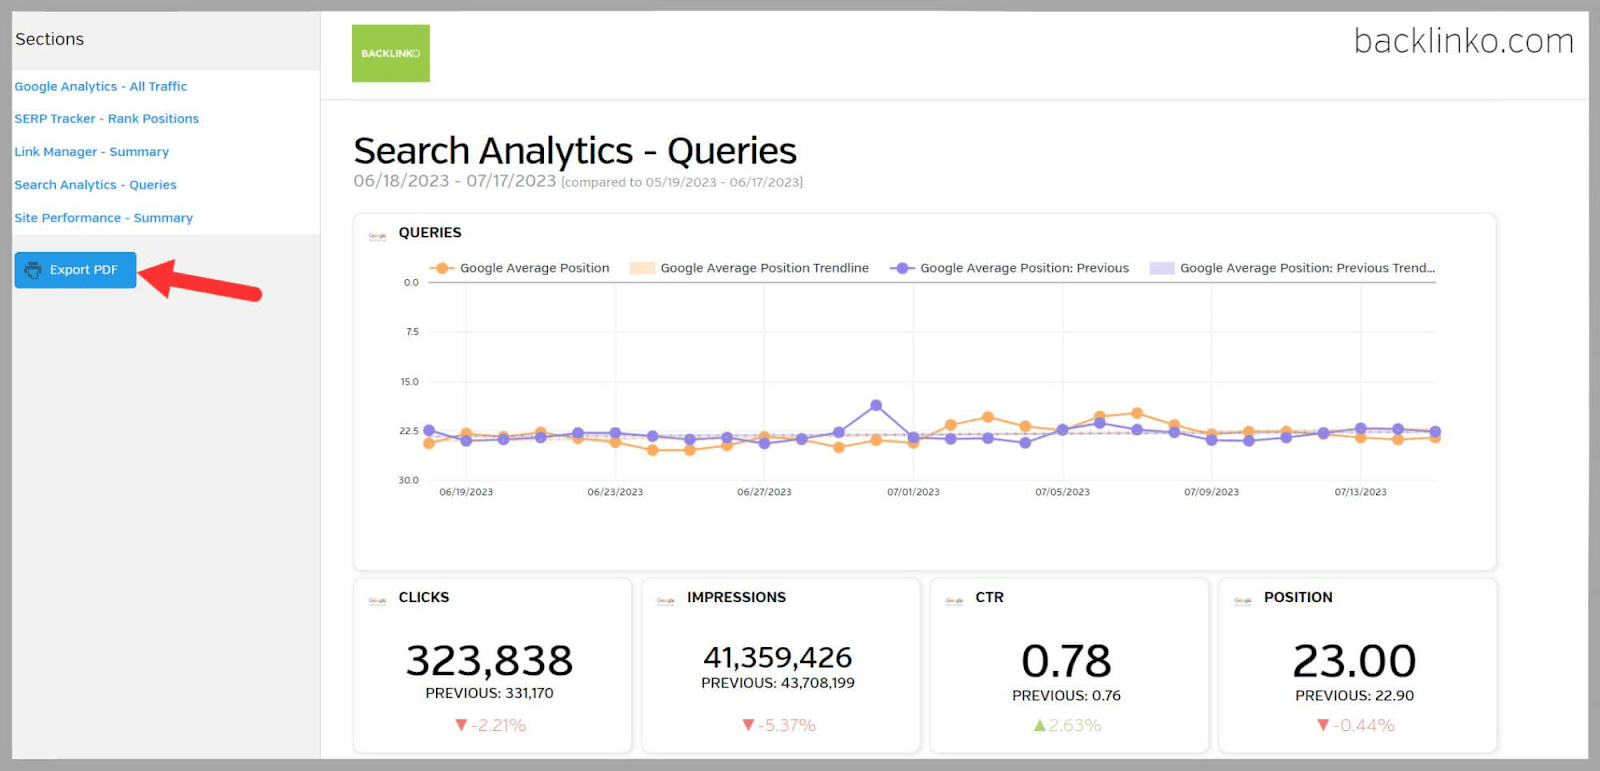
Once you’ve published it, you can view it and export it as a PDF.
WYSIWYG reports are SUPER useful.
You can edit them as you go so that there’s no back-and-forth between you and the client once the report is published.
This saves you plenty of time and hassle.
The fact you can customize and brand your reports is great too…
Raven Tools Pricing
Raven Tools’ pricing is split into five different plans:
- Small Biz
- Start
- Grow
- Thrive
- Lead
It’s pretty affordable when compared to other tools out there.
So, how much do the plans cost and what do you get with each one?
Small Biz
Price
- $49/month when paid monthly
- $39/month when paid annually
What you get
- 1,500 position checks
- 2 users
- 2 domains/campaigns
Start
Price
- $109/month when paid monthly
- $79/month when paid monthly
What you get
- 15,000 position checks
- 4 users
- 20 domains/campaigns
Grow
Price
- $199/month when paid monthly
- $139/month when paid annually
What you get
- 20,000 position checks
- 8 users
- 80 domains/campaigns
Thrive
Price
- $299/month when paid monthly
- $249/month when paid annually
What you get
- 25,000 position checks
- 20 users
- 160 domains/campaigns
Lead
Price
- $479/month when paid monthly
- $399/month when paid annually
What you get
- 30,000 position checks
- 40 users
- 320 domains/campaigns
Raven Tools Pros and Cons
Pros
- It’s easy to set up
- Allows scheduling of reports
- Integrates with many other platforms such as Google Analytics which means it’s perfect for managing multiple campaigns from one tool
- Affordable
- A 7-day free trial that doesn’t require any credit card details when you sign up
Cons
- Certain features are confusing to navigate
- The ability to customize reports is limited
- Its features aren’t as powerful as some competitors like Semrush
- There aren’t many guides within Raven Tools on how to use the features
Raven Tools Vs Competitors
Raven Tools Vs Semrush
- Semrush offers much more comprehensive features than Raven Tools
- Semrush’s Backlink Gap, Backlink Analytics, and Link Building Tool make it a much better choice than Raven Tools for link building
- Semrush’s full Keyword Research Suite, including the Keyword Magic Tool, also make it far superior when it comes to keyword research
- Although Raven Tools’ Content Manager is alright for creating content, Semrush offers an AI Writing Assistant that speeds up the process. Plus, Semrush’s Content Marketing Tool gives you access to SEO Content Templates, an SEO Writing Assistant, and an in-depth Topic Research tool.
- Semrush’s Site Audit Tool is far more detailed than Raven Tools. It gives you data on vital metrics like crawlability and core web vitals.
- Semrush also allows you to create more insightful reports than Raven Tools. The My Reports feature lets you customize every aspect of your reports. Plus, like with Raven Tools’ WYSIWYG reports, you can white-label and brand them.
- Both tools are good for social media management but Semrush offers more functionality
Semrush is more suited to businesses and marketers looking for an all-in-one toolset with advanced features - Raven Tools is best suited to small to medium-sized businesses or marketers on a budget
- Raven Tools’ cheapest plan starts at $39 per month (paid annually) and Semrush’s cheapest plan starts at $108.33 per month (paid annually)
Raven Tools Vs Moz Pro
- Raven Tools has less advanced features and data depth than Moz Pro
- Raven Tools is a simpler tool with fairly basic SEO and marketing capabilities
- Moz Pro is more expensive than Raven Tools. Its cheapest plan starts at $79 per month (paid annually)
Raven Tools Vs SpyFu
- SpyFu is better at competitive analysis than Raven Tools. It allows users to spy on their competitors’ keywords, ad campaigns, and SEO strategies in great detail
- SpyFu also offers more in-depth competitor insights than Raven Tools
- SpyFu is easier to navigate than Raven Tools and the tool has helpful guides for every feature
- SpyFu is even more affordable than Raven Tools. Its cheapest plan starts at $16 per month (paid annually)
FAQs
What level of customer support does Raven Tools offer?
Raven Tools offers customer support via email. The email address to use is help@raventools.com.
Raven Tools doesn’t appear to have a phone number for its support team. Still, most of the reviews online for Raven Tools’ customer support team are positive. They tend to focus on the fact that the team is fairly responsive and usually knows how to resolve the issues customers have.
Does Raven Tools have a free trial?
Yes, Raven Tools offers a 7-day free trial. Unlike many SEO tools, Raven Tools doesn’t require any credit card details when you sign up for the trial.
The trial itself is also pretty generous. You can use all of the Raven Tools features and the credit limits you receive for each feature are quite high.
What integrations does Raven Tools have?
- Raven Tools integrates with:
- Bing Ads
- Bing Webmaster Tools
- Constant Contact
- Campaign Monitor
- Mailchimp
- Google Ads
- Google Analytics
- Facebook Ads
- Google Search Console
- Zapier
- YouTube
Content Copyrights Belong to The Author. All Rights Reserved.
We're A Dallas Digital Marketing Agency That is Experts At Social Media Marketing, Website Design and Emarketing and Promotion.

