Enterprise SEO metrics are key performance indicators (KPIs) used to measure the effectiveness of your SEO efforts. Monitoring these metrics helps you prove value and shows the success of your SEO program.
You’ll create a lot of different SEO reports for a lot of different people in an enterprise environment. Let’s look at some of the reports you’ll want to create and the metrics to include in them for different people.
SEO metrics for your website
Many of the most common enterprise SEO reports are based on metrics for your own website. Lots of teams and even other SEOs will want to see various SEO metrics to see how things are going.
YoY and MoM statistics
You can compare metrics between two dates on Overview. Here, you can see changes for Ahrefs Rank (AR), Links, Referring Domains, Keywords, Traffic, and Traffic Value in the last year.

YoY trends
You can also look at YoY trends for your own site. You may want to use your GSC or analytics data if you have it, but GSC is typically limited to 16 months of data. If you’ve connected it to Ahrefs though, we store and show a longer period of time and you’ll eventually be able to show the YoY data for this for multiple years.
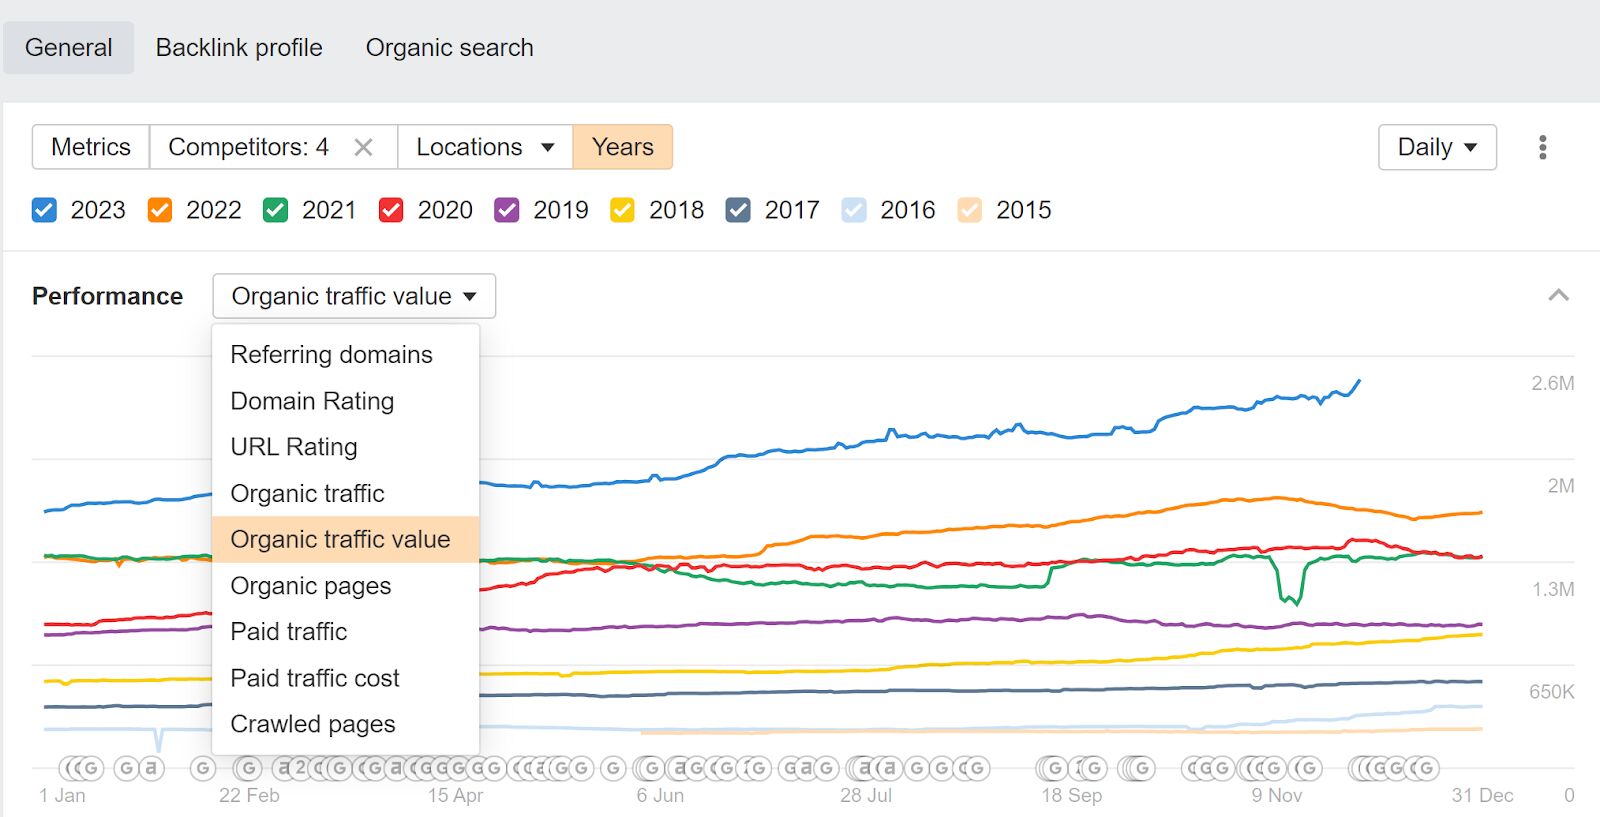
You can also use the Years tab in Overview along with average volume to show general trends or issues. We show trends for Organic Traffic Value, Organic Traffic, Referring Domains, Domain Rating, URL Rating, Organic Pages, and Crawled pages.
Brand vs. non-brand breakdown
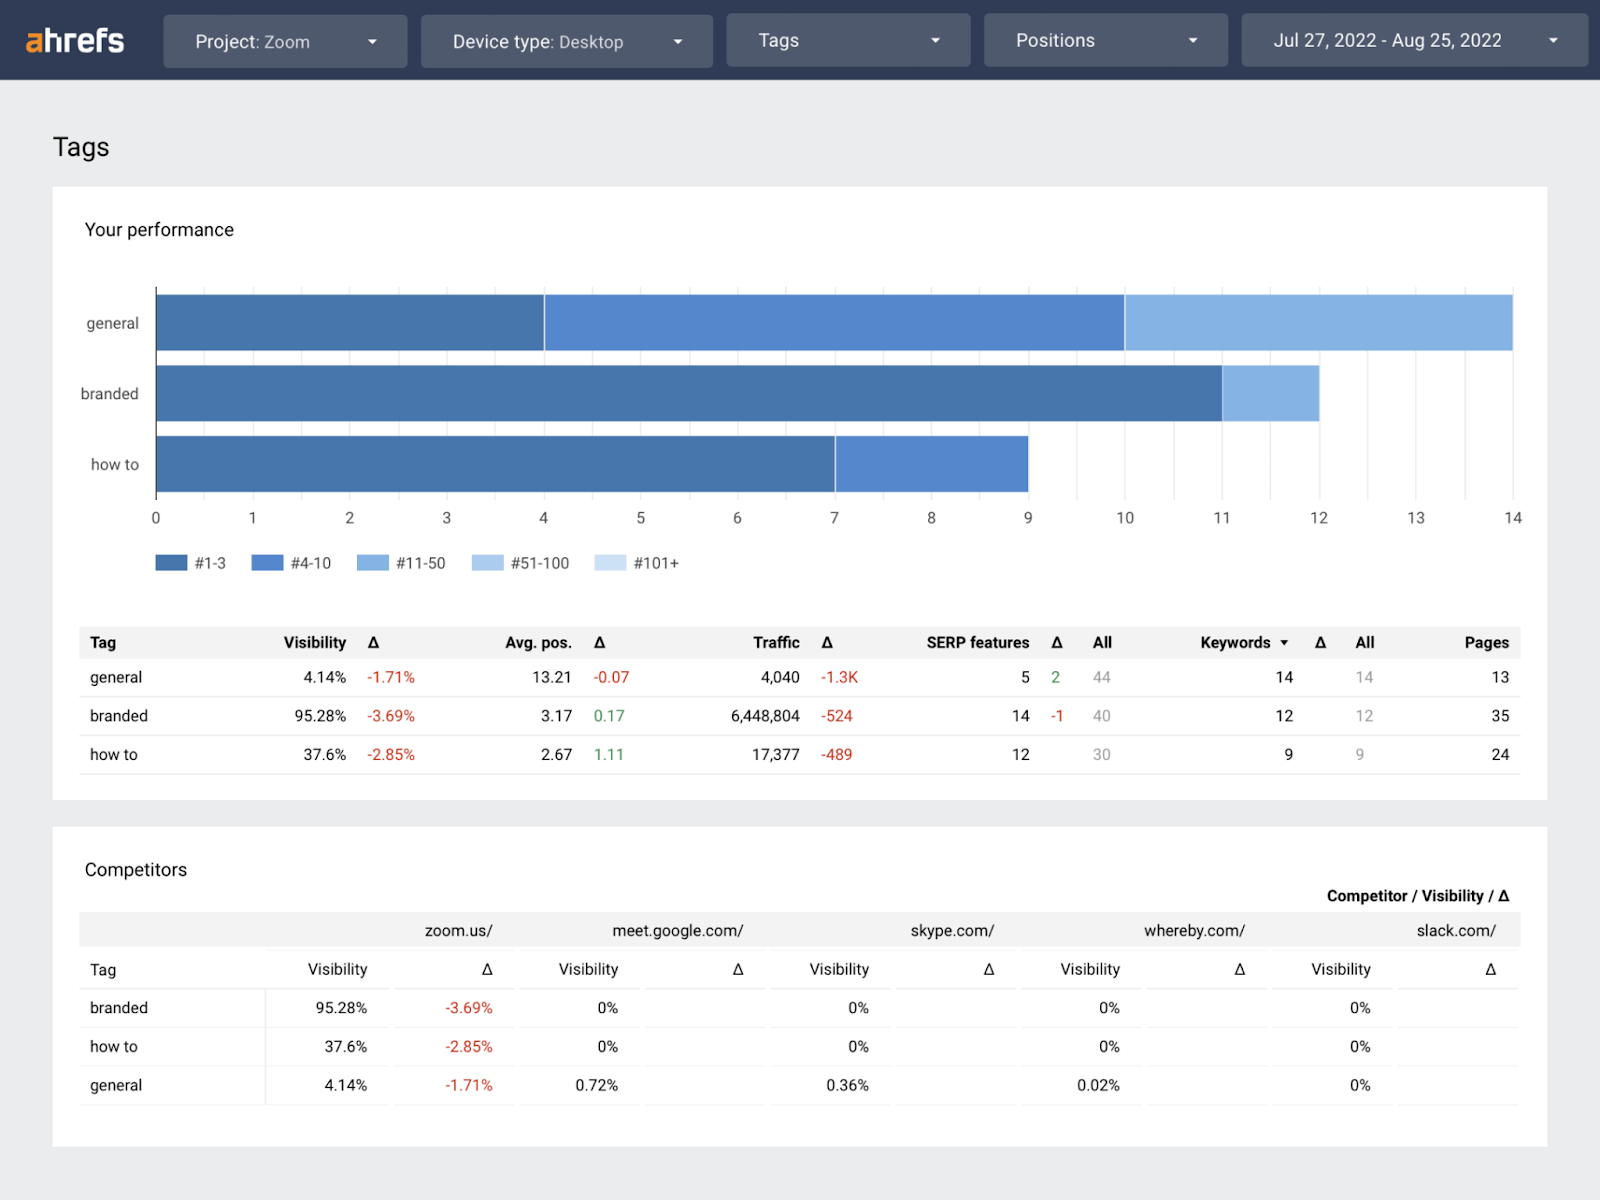
I typically split branded and non-branded terms with Looker Studio and a custom list of branded terms. You can use either GSC or Ahrefs data for it. This is what the filter looks like. You can also use the tagging system in Rank Tracker to tag branded terms and get the breakdown there.

Critical page and keyword monitoring
Enterprise companies will typically have some kind of top pages or top keywords project. These look at the most critical pages and/or keywords for your business and help you see their performance over time and any trends or issues.
They’re typically used in meetings where there is a quick analysis and an action plan created for any issues or for any successes. You try to look at what worked well so you can replicate it, and try to look for any issues to see what happened.
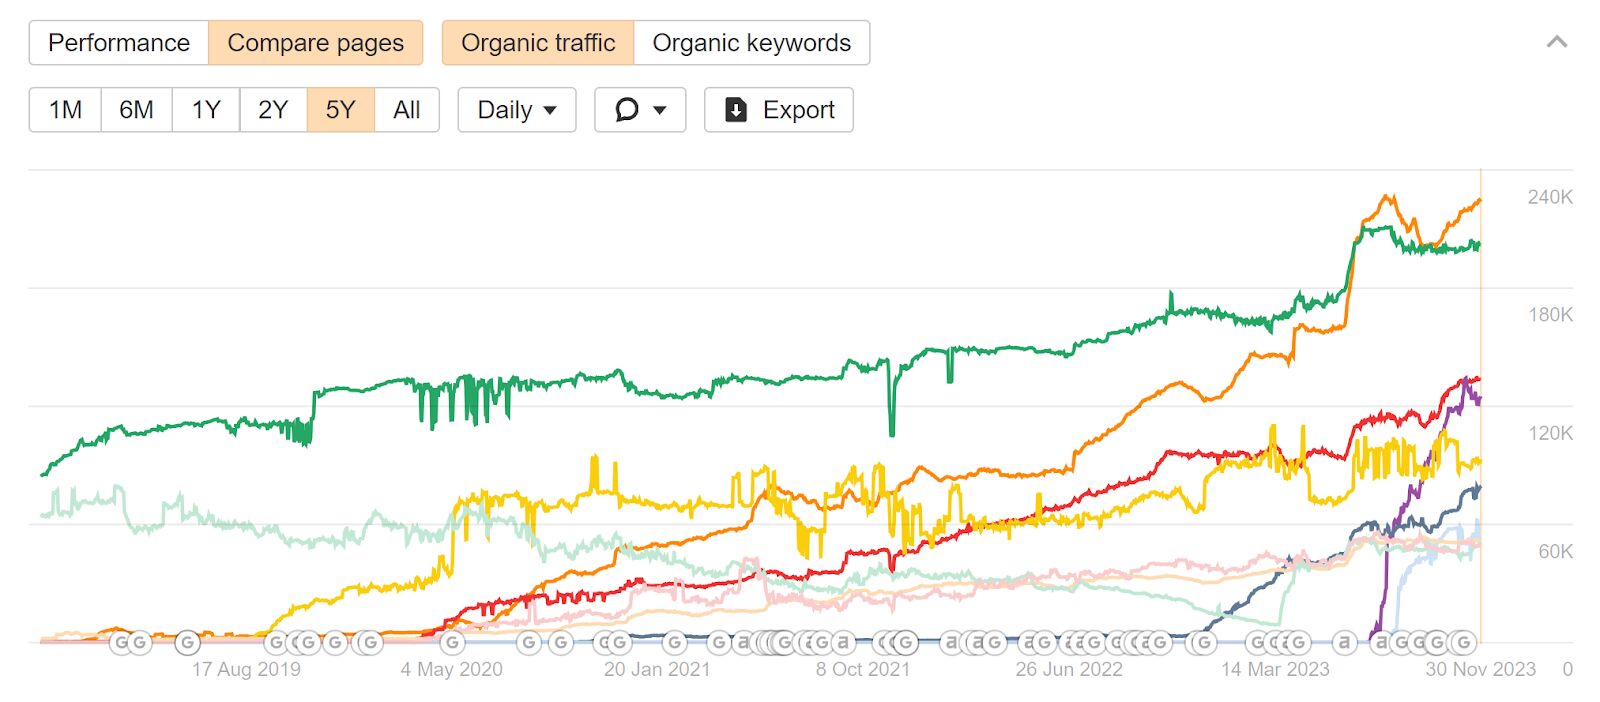
You can use the Compare pages tab in the Top Pages report in Site Explorer to get this kind of view for your pages. We will be adding one for the Organic Keywords report in the future as well.
Enterprise SEO scorecards
We already talked about competitor SEO scorecards, but there are also normal SEO scorecards that you can use to monitor performance and compare one group to another or one section of a site to another.
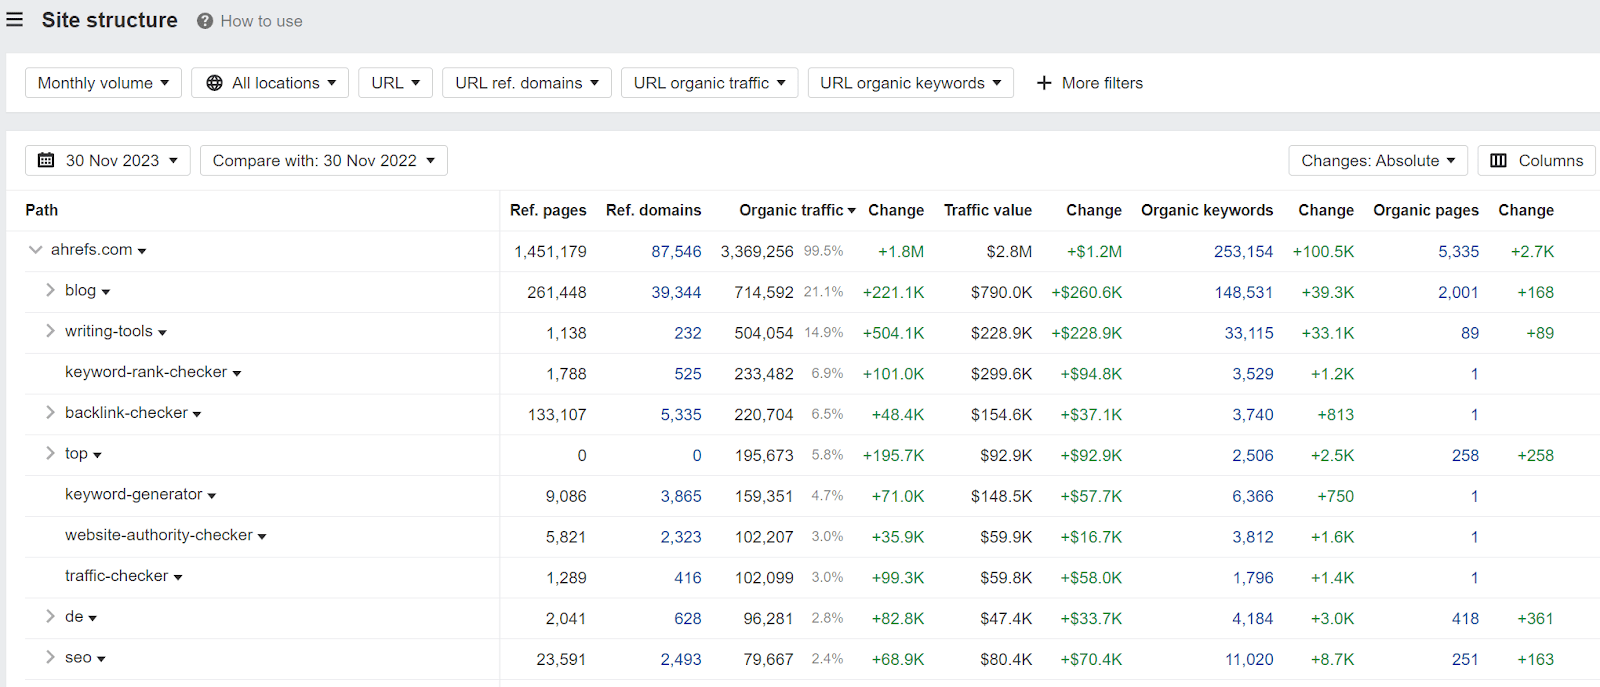
Our Site Structure report in Site Explorer has a lot of the information you’d use to create this scorecard view. You can even compare between two dates.
The columns are customizable so you can show only the metrics you need. We have Referring Pages, Referring Domains, Organic Traffic, Traffic Value, Organic Keywords, and Organic Pages available.
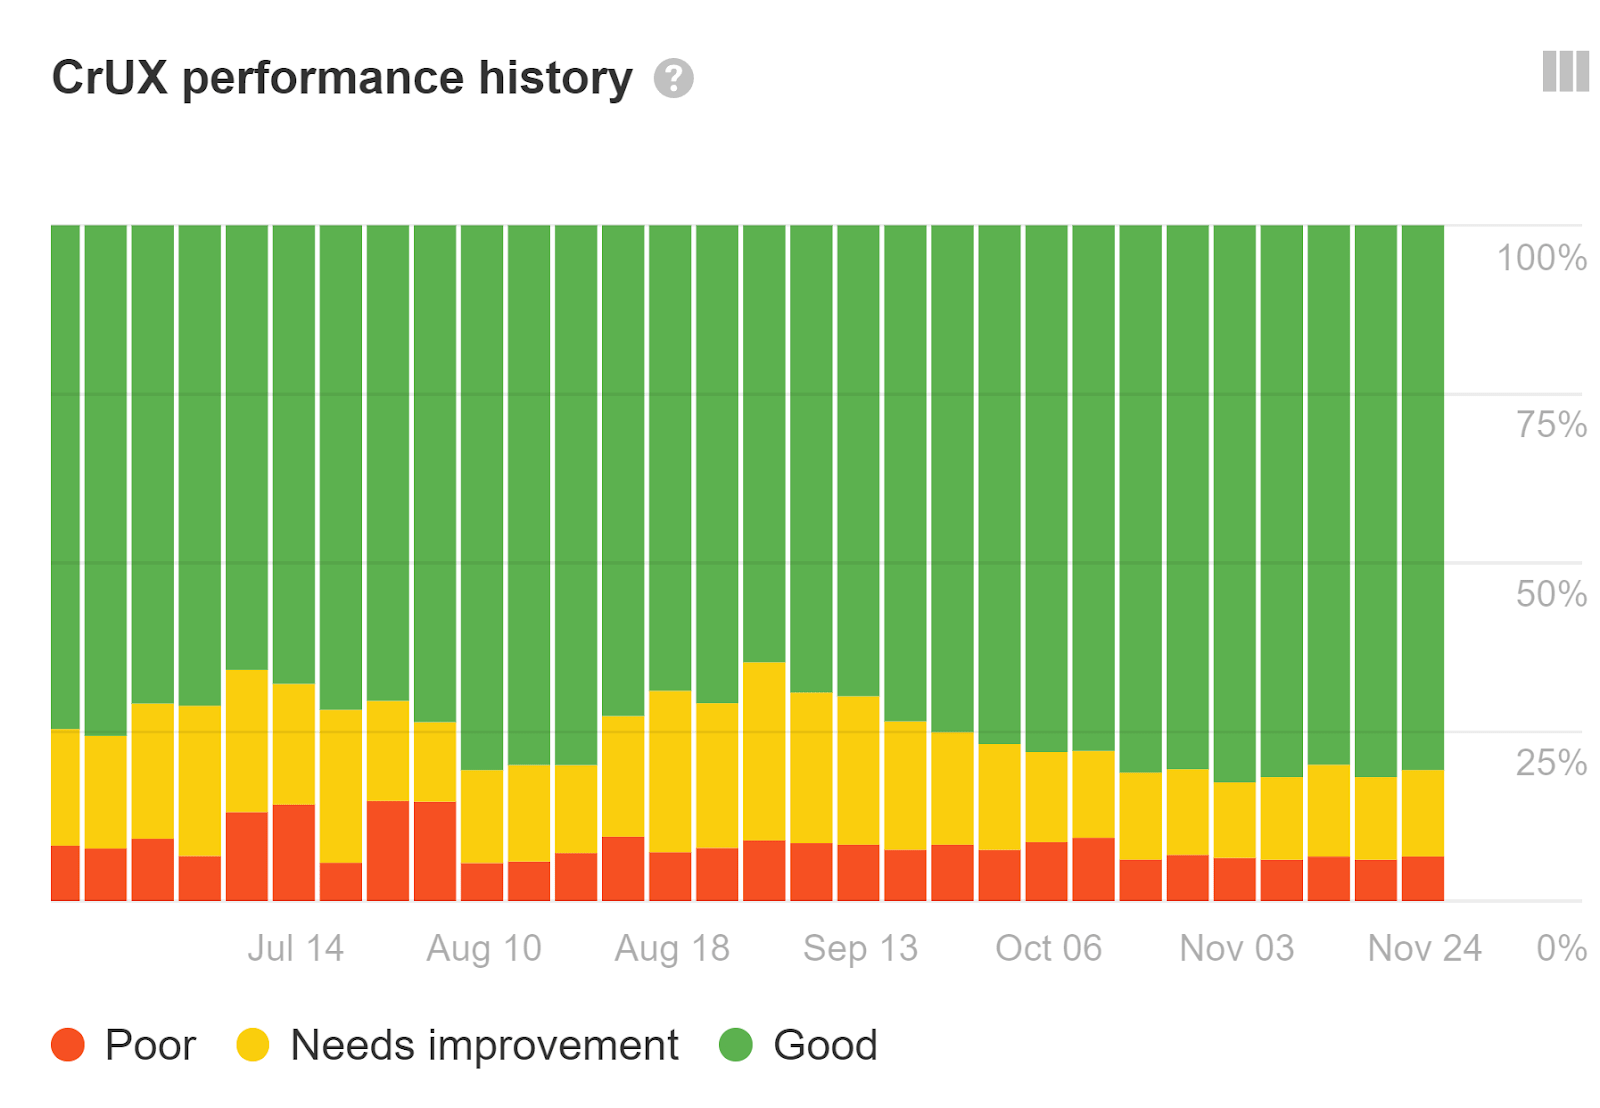
You can pull technical issues from Site Audit where you might want to show health scores over time for different sections of the site, Core Web Vitals, or general errors. In the past, I’ve created views that showed the number of pages we still need to redirect, Core Web Vitals scoring, and pages that have too many redirect hops.
You can also create custom groupings of pages using our Portfolios feature. If you have a business unit or product offering that owns some pages on the blog, some pages in the product section, some pages in support, etc., then you can add them as a Portfolio to get a rolled up view. Portfolios support up to 10 different domains and 1,000 different pages or paths.
Rankings
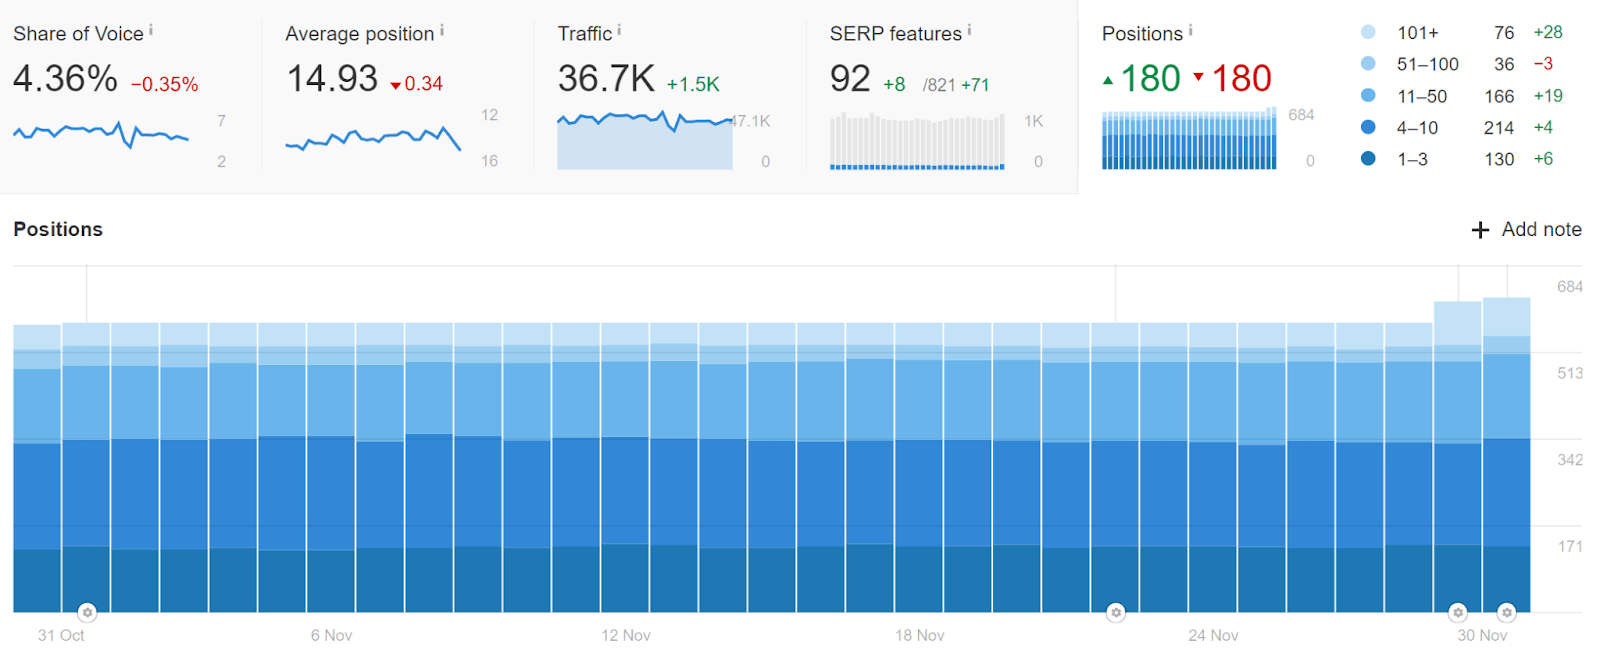
Rank Tracker allows for custom segmentation via a flexible tagging system. You can have branded and unbranded, specific product or business unit tags, authors, top 20, or any number of groupings for your own use cases. There are a number of different things you can track, but lots of people typically want to see rankings.
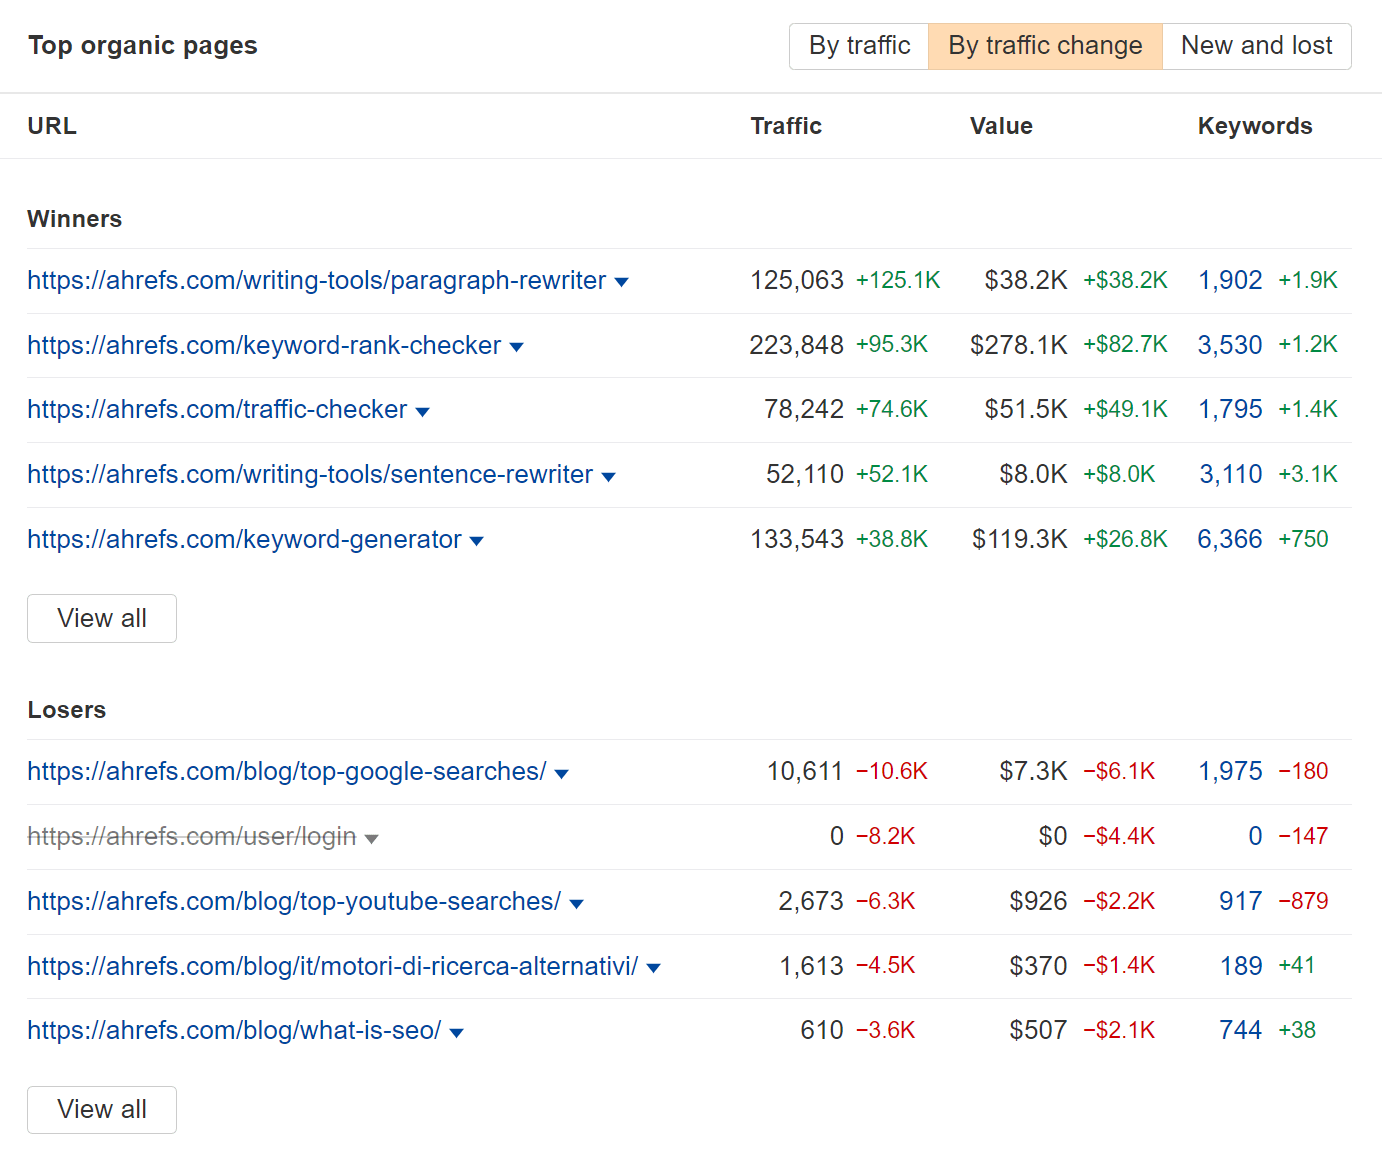
Winners & losers for pages and keywords
You’ll want to check your own pages and keywords to see what’s working well and what’s not. You can do this on the Dashboard or with filters on the individual reports to see more data.
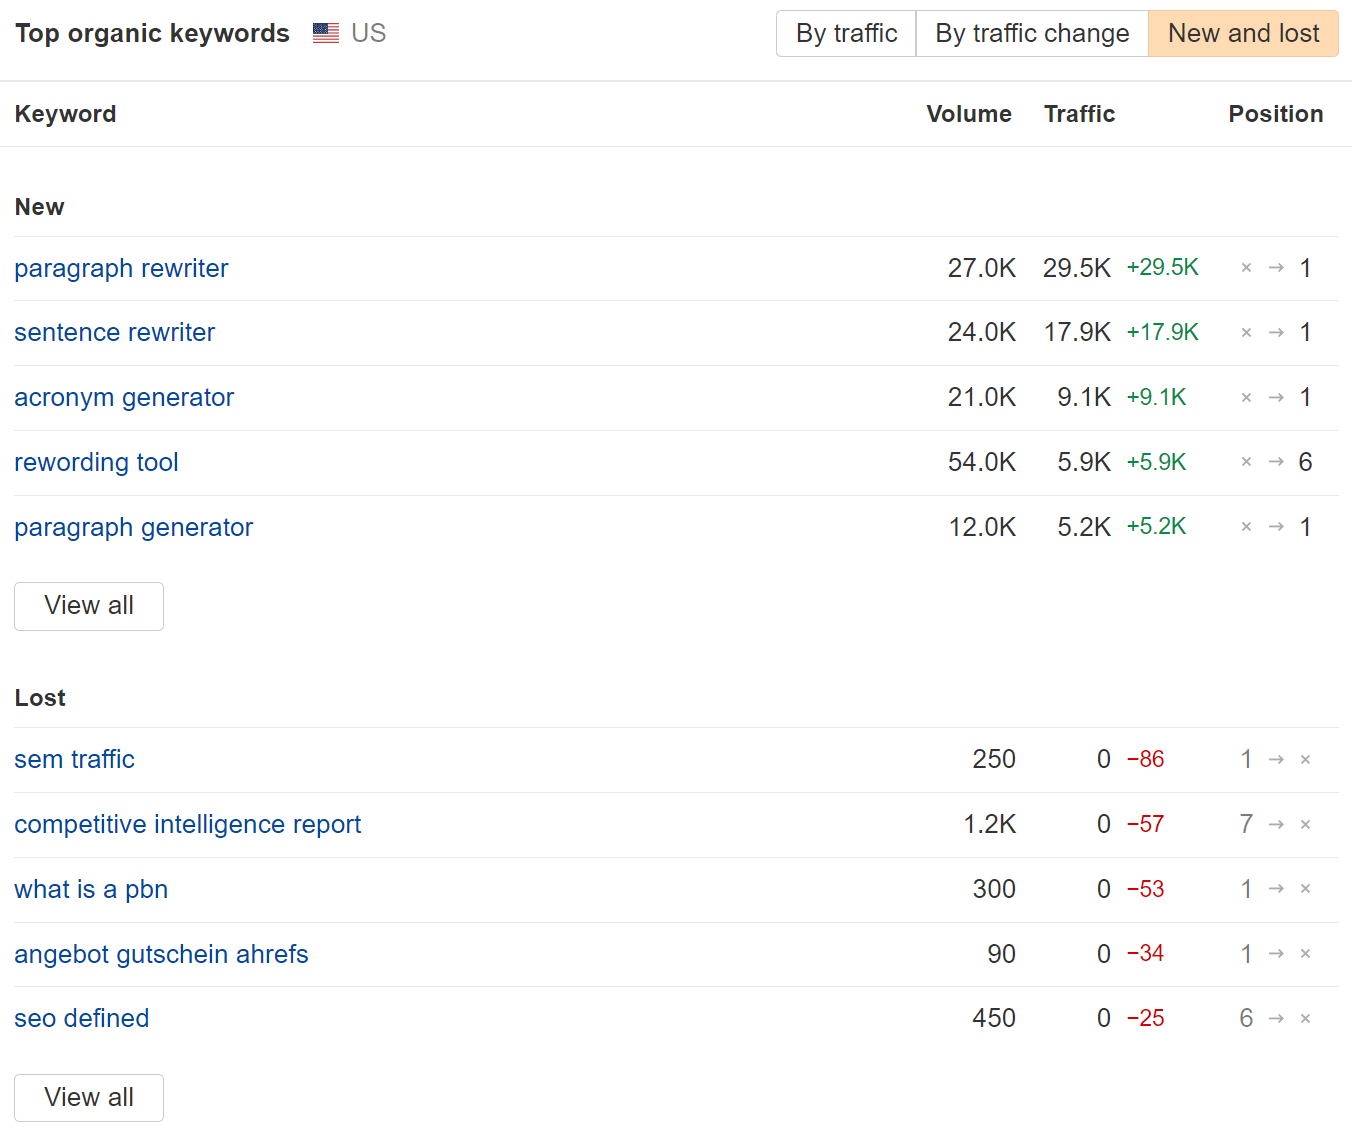
New & lost for pages and keywords
As an enterprise SEO, you can’t be everywhere at once or have visibility on every project happening on the site. You can use the new and lost reports for keywords and pages to help monitor what is changing on the site. Again, this is available on the Dashboard or you can filter for them in the individual reports like Organic Keywords or Top Pages.
Content performance
If you’re running A/B tests, improving a group of pages, or want to monitor different authors or even business units or products who may have multiple sections, you can use the Portfolio feature on the Dashboard to add up to 1,000 pages or sections across 10 domains.

Many of the reports in Site Explorer will give you rolled up views of the content. Now you can easily see if your tests or improvements had an impact or create a scorecard view for different authors or parts of the business to check how each is doing.
You may want to report on content scores for top pages or averages across pages or groups of pages or authors to show that your content is improving. We’ll be able to help with this soon.
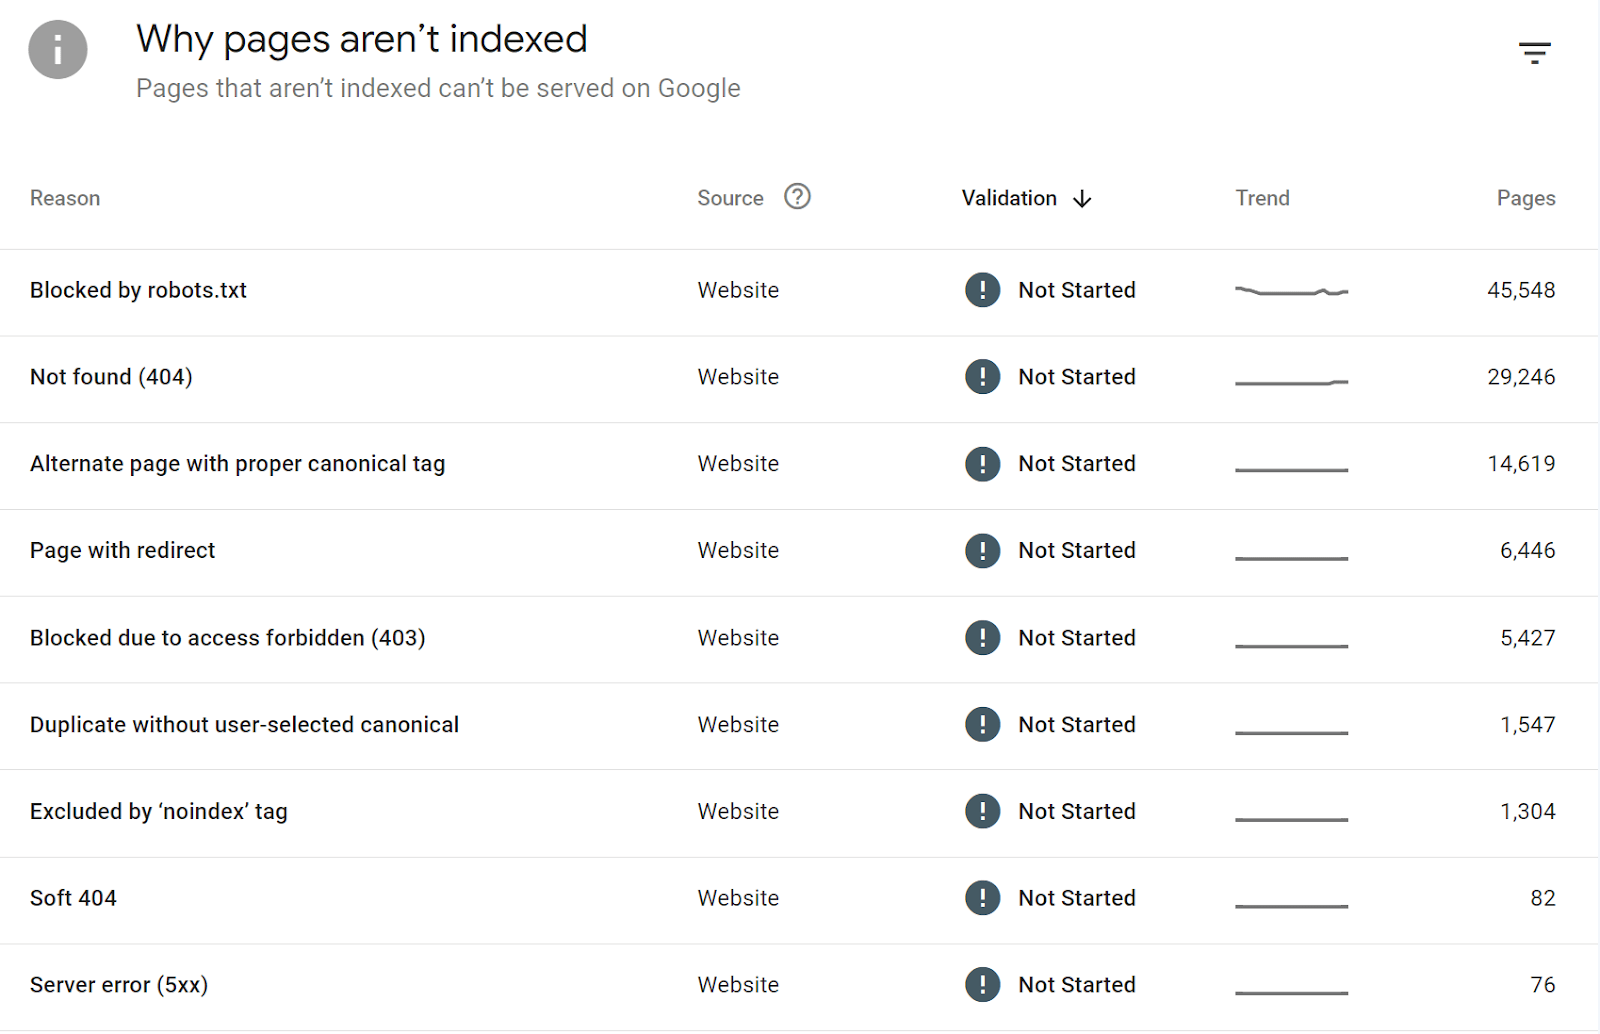
Index coverage errors
Check the Page Indexing report in GSC. It shows you how many pages are indexed and not indexed and has different buckets telling you why pages aren’t indexed.
Status or project reports
Your boss and execs usually want to know what you and your team are working on and how things are going. For instance, you might report on the progress of any initiatives like 3/9 planned projects completed, you improved website health by three points, etc.
You might also want to create impact reports. For example, let’s say you’re running A/B tests for related things in a group of pages. By adding these pages to a Portfolio on the Dashboard, you’ll be able to see improvements or compare any two dates to better see the impact of your testing.
Almost every company has projects around creating new pages or updating existing pages, so you could report the numbers for those. This type of report could really include anything like indexing issues fixed, outreach emails sent, etc.
You might want to create these in scorecard views as well so that you can see the progress different products or groups are making towards initiatives. That way you can see if someone or some group is stuck and figure out how you can help them make progress.
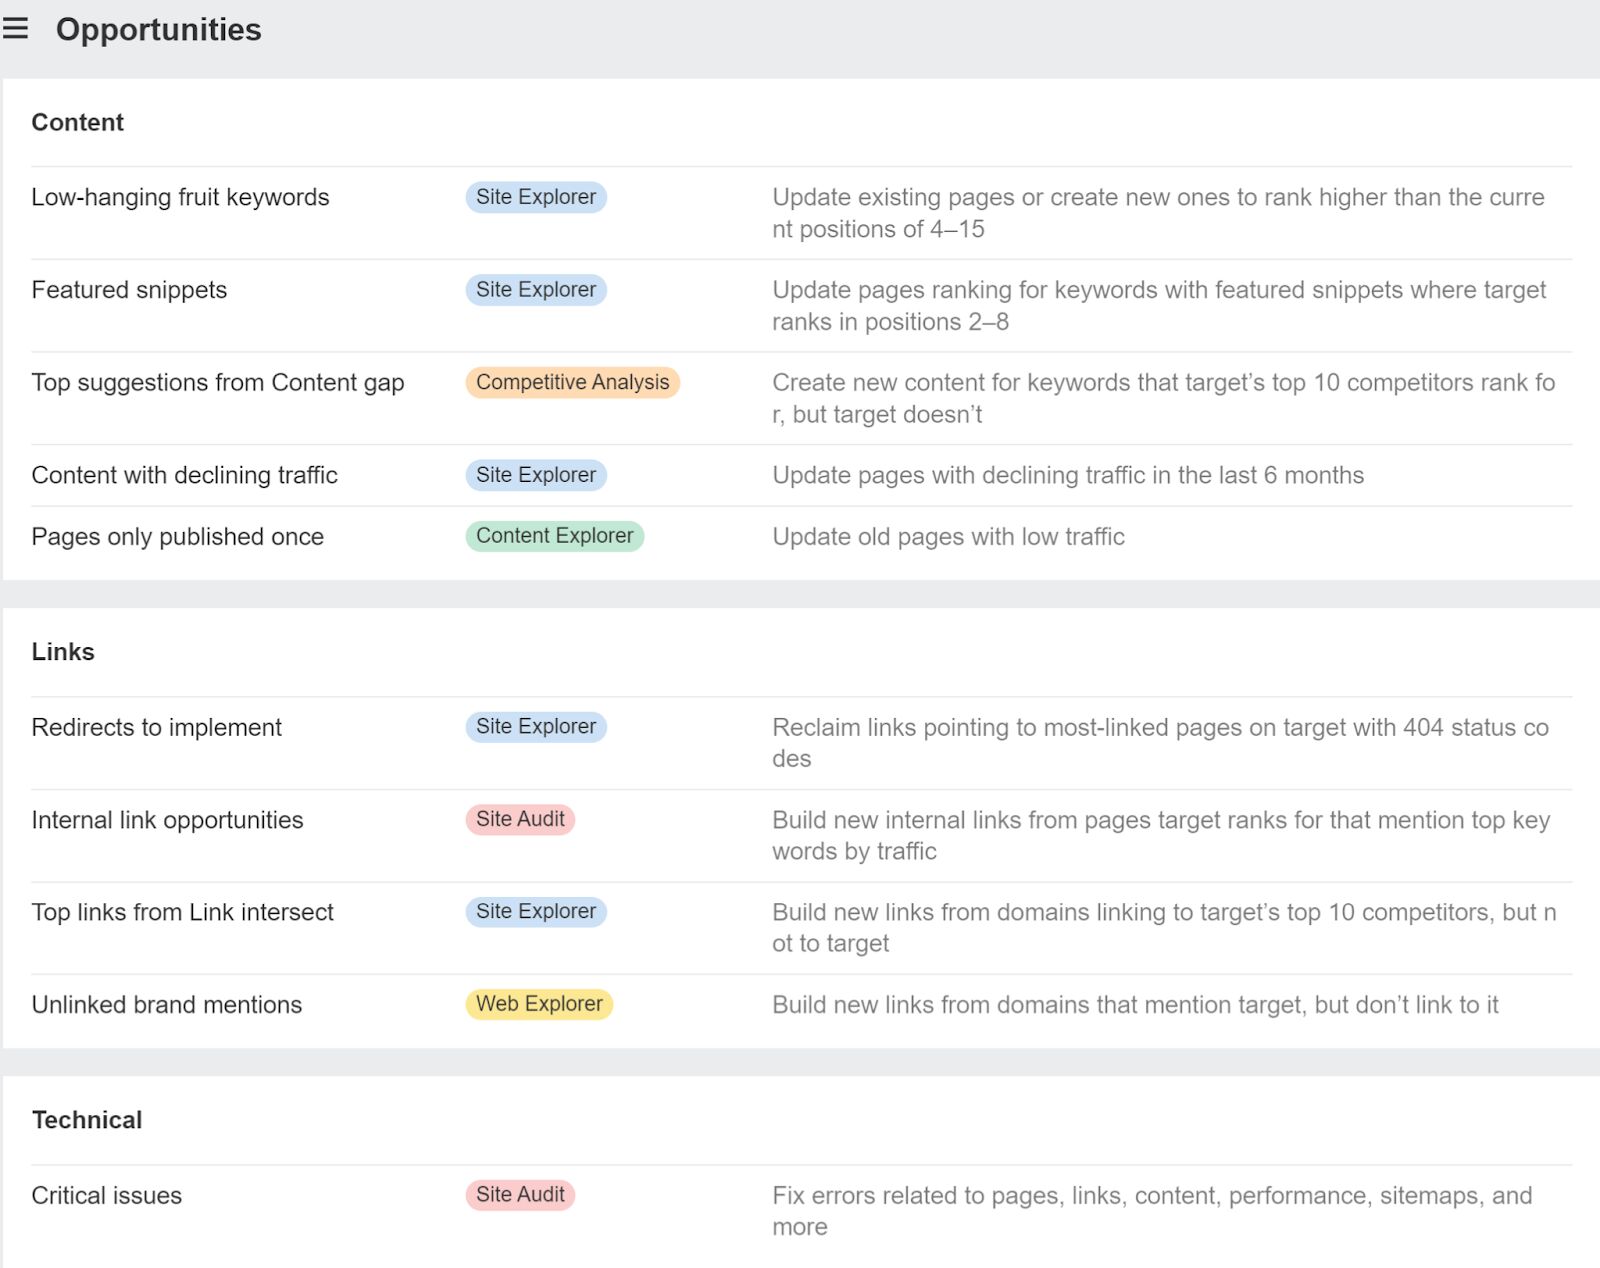
Knowing what to prioritize is the hardest part of SEO. We created the Opportunities report to help you work on things that will move the needle. If you’re not sure where to start, look at these reports and measure progress towards the opportunities shown and you will likely show a lot of success to your stakeholders. This report is a great starting point for an enterprise SEO audit.
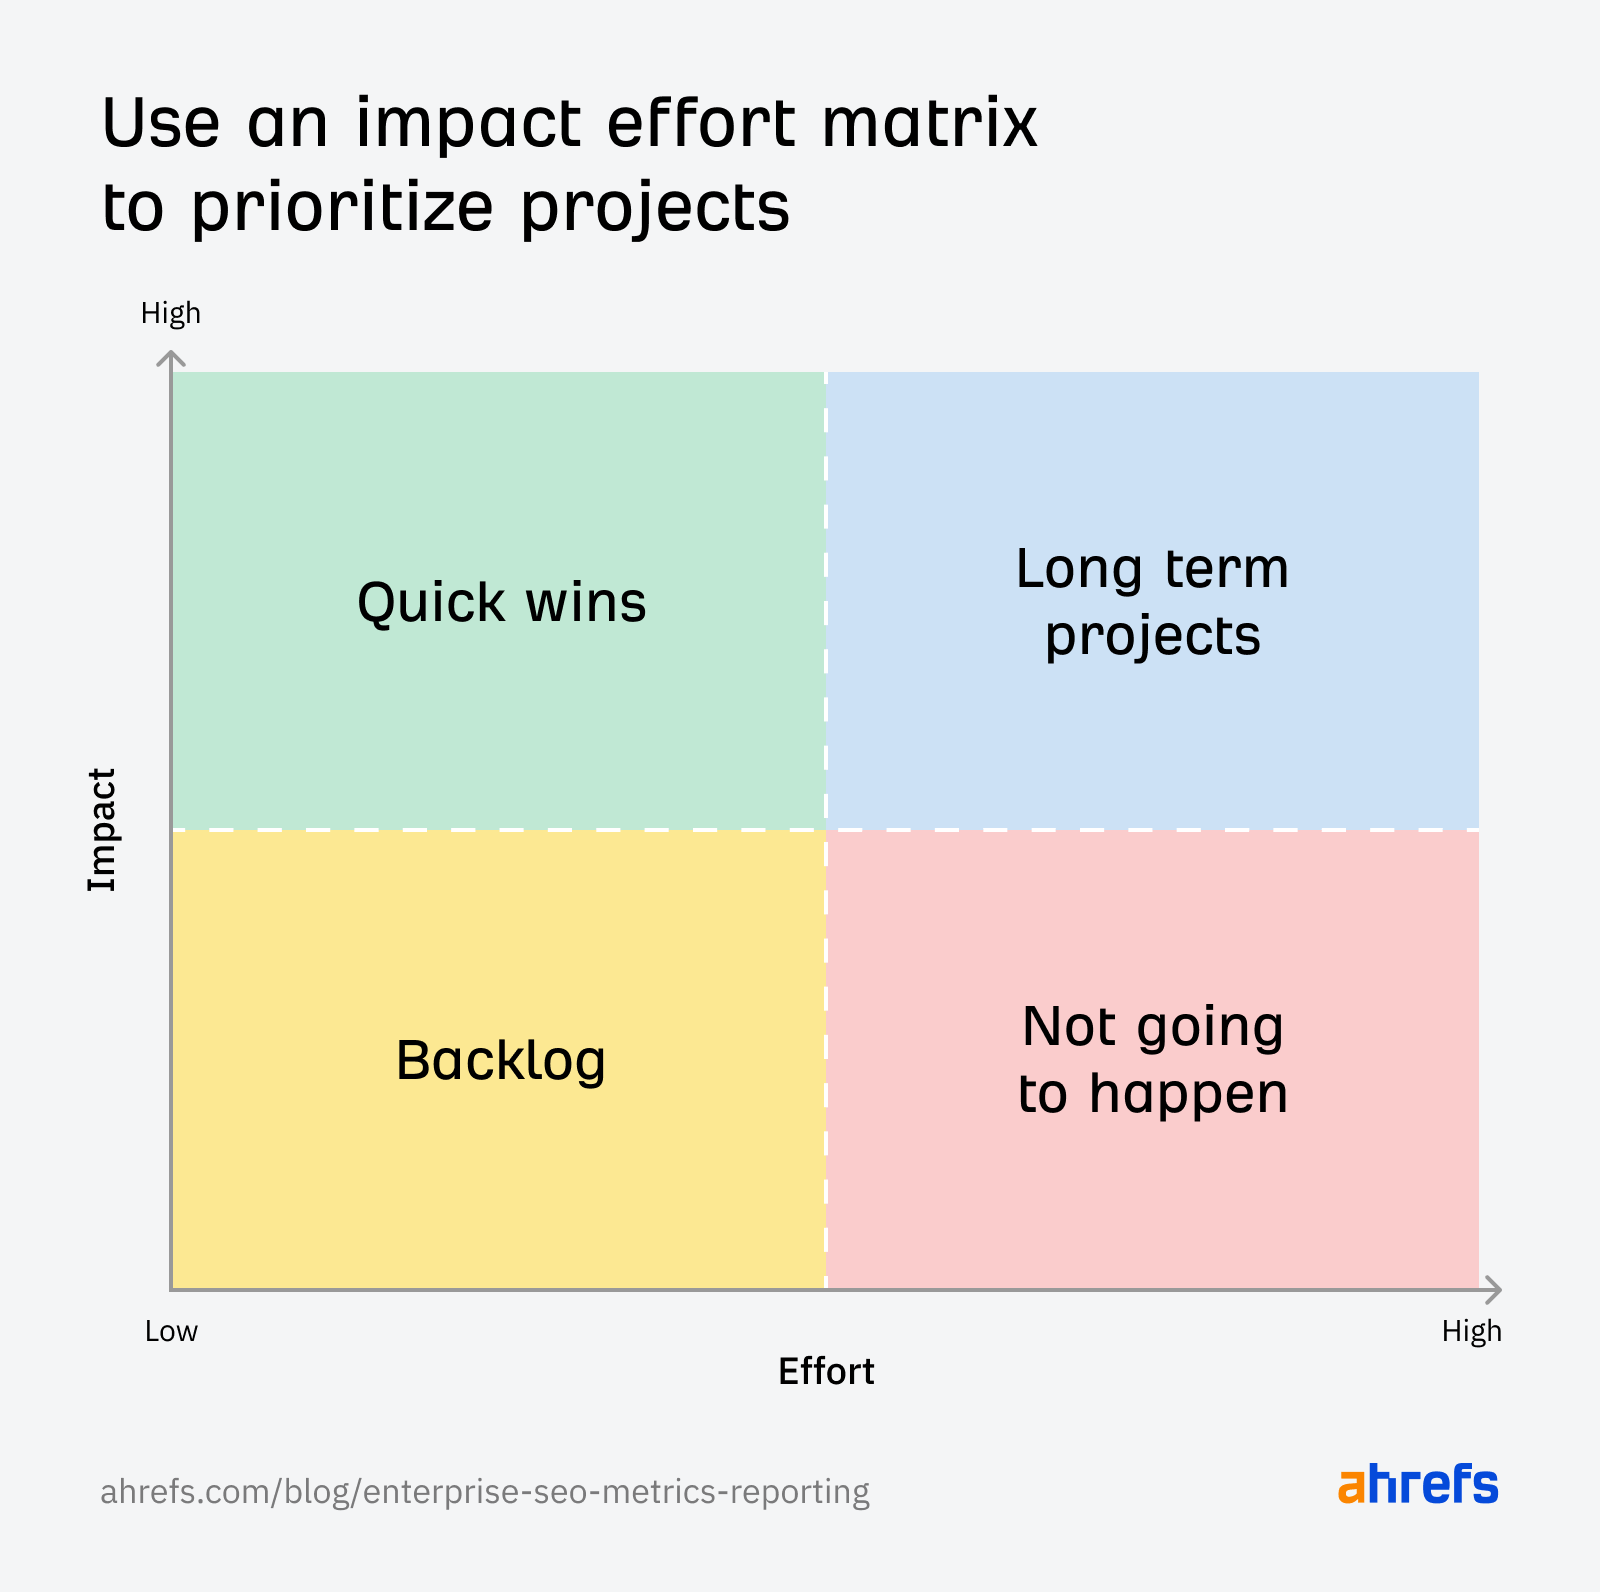
You could also work with the in-house team or the dev team if you are in-house to create a visualization of what you consider the most important and impactful SEO projects. I normally use an impact / effort matrix for this to show how hard projects are and their estimated impact. Based on their coordinates, it’s easy to see which projects you should prioritize.
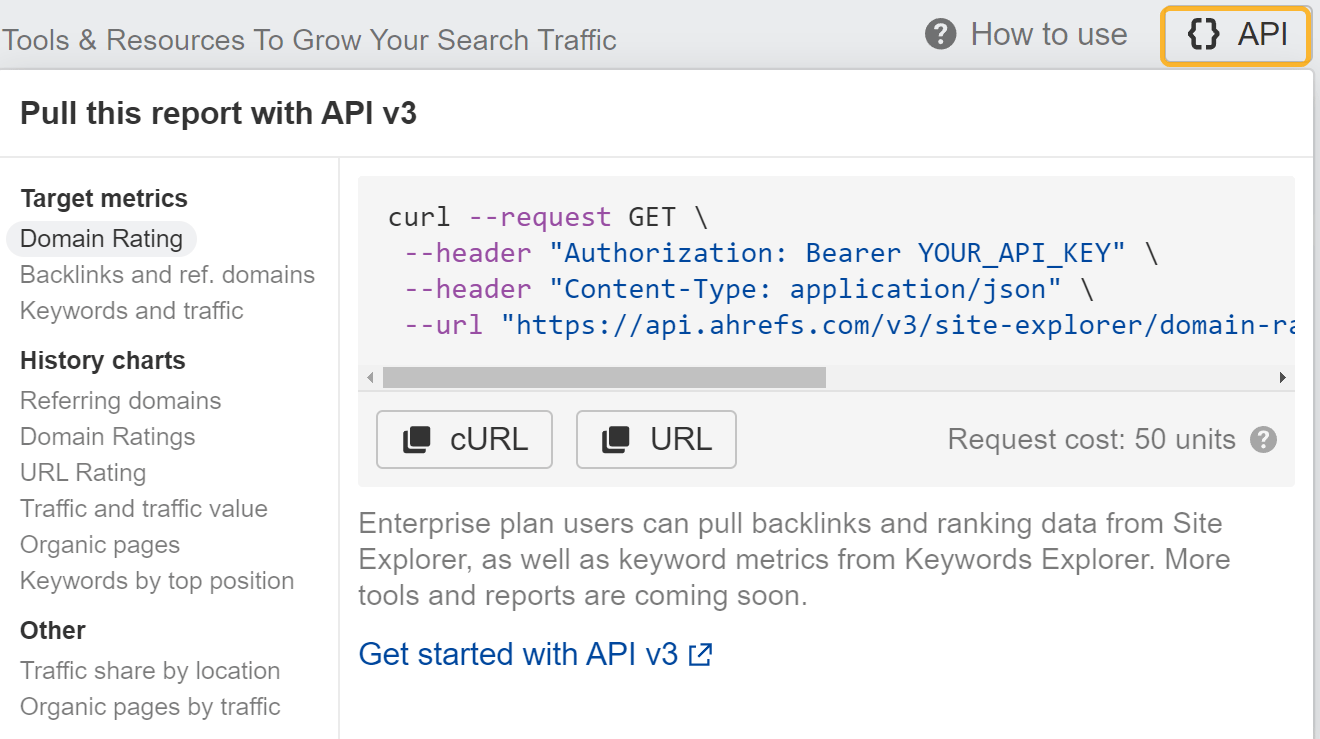
In most of our reports, we have an API button that will let you pull the data needed from the reports to re-create the visuals we have or any custom ones you want to create in your own reporting platform. We tried to make this as easy as possible for everyone. You can also check our API documentation for any custom data pulls you might want to make.
We also have Looker Studio templates you can use to create your reports. These are customizable and well documented.
Content Copyrights Belong to The Author. All Rights Reserved.
We're A Dallas Digital Marketing Agency That is Experts At Social Media Marketing, Website Design and Emarketing and Promotion.

