Temu is a popular shopping marketplace known for its ultra-low prices owned by PDD Holdings.
Launched in 2022, the platform quickly gained a massive following thanks to significant marketing investments and a gamified shopping concept with tons of deals.
Today, the Temu mobile app has more than 167 million monthly active users, and annual sales are forecasted to reach $37 billion in 2024.
Continue reading to find the latest statistics on Temu in 2024.
Here’s a quick overview of what you’ll find on this page:
Key Temu Stats
- Temu has 167 million monthly active users worldwide.
- In the US, 50.4 million users access the Temu mobile app at least once a month.
- Nearly 3 in 10 US adults have shopped at Temu in the past 12 months.
- Temu’s gross merchandise value reached $15.33 billion in 2023.
- In the US, Temu claimed a 17% market share within the discount store category.
Temu Monthly Active Users Worldwide
As of Q1 2024, the Temu app has 167 million monthly active users worldwide.
That’s up from 23.4 million monthly active users in Q1 2023, representing a year-over-year increase of 614%.
Source: Investor’s Business Daily
Temu Monthly Active Users in the US
Temu has 50.4 million monthly active users in the US as of Q1 2024.

That’s an increase from 21.5 million monthly active users in Q1 2023.
Source: Investor’s Business Daily
Temu App Downloads Worldwide
The number of Temu app downloads reached 165.12 million in 2024 (as of April).
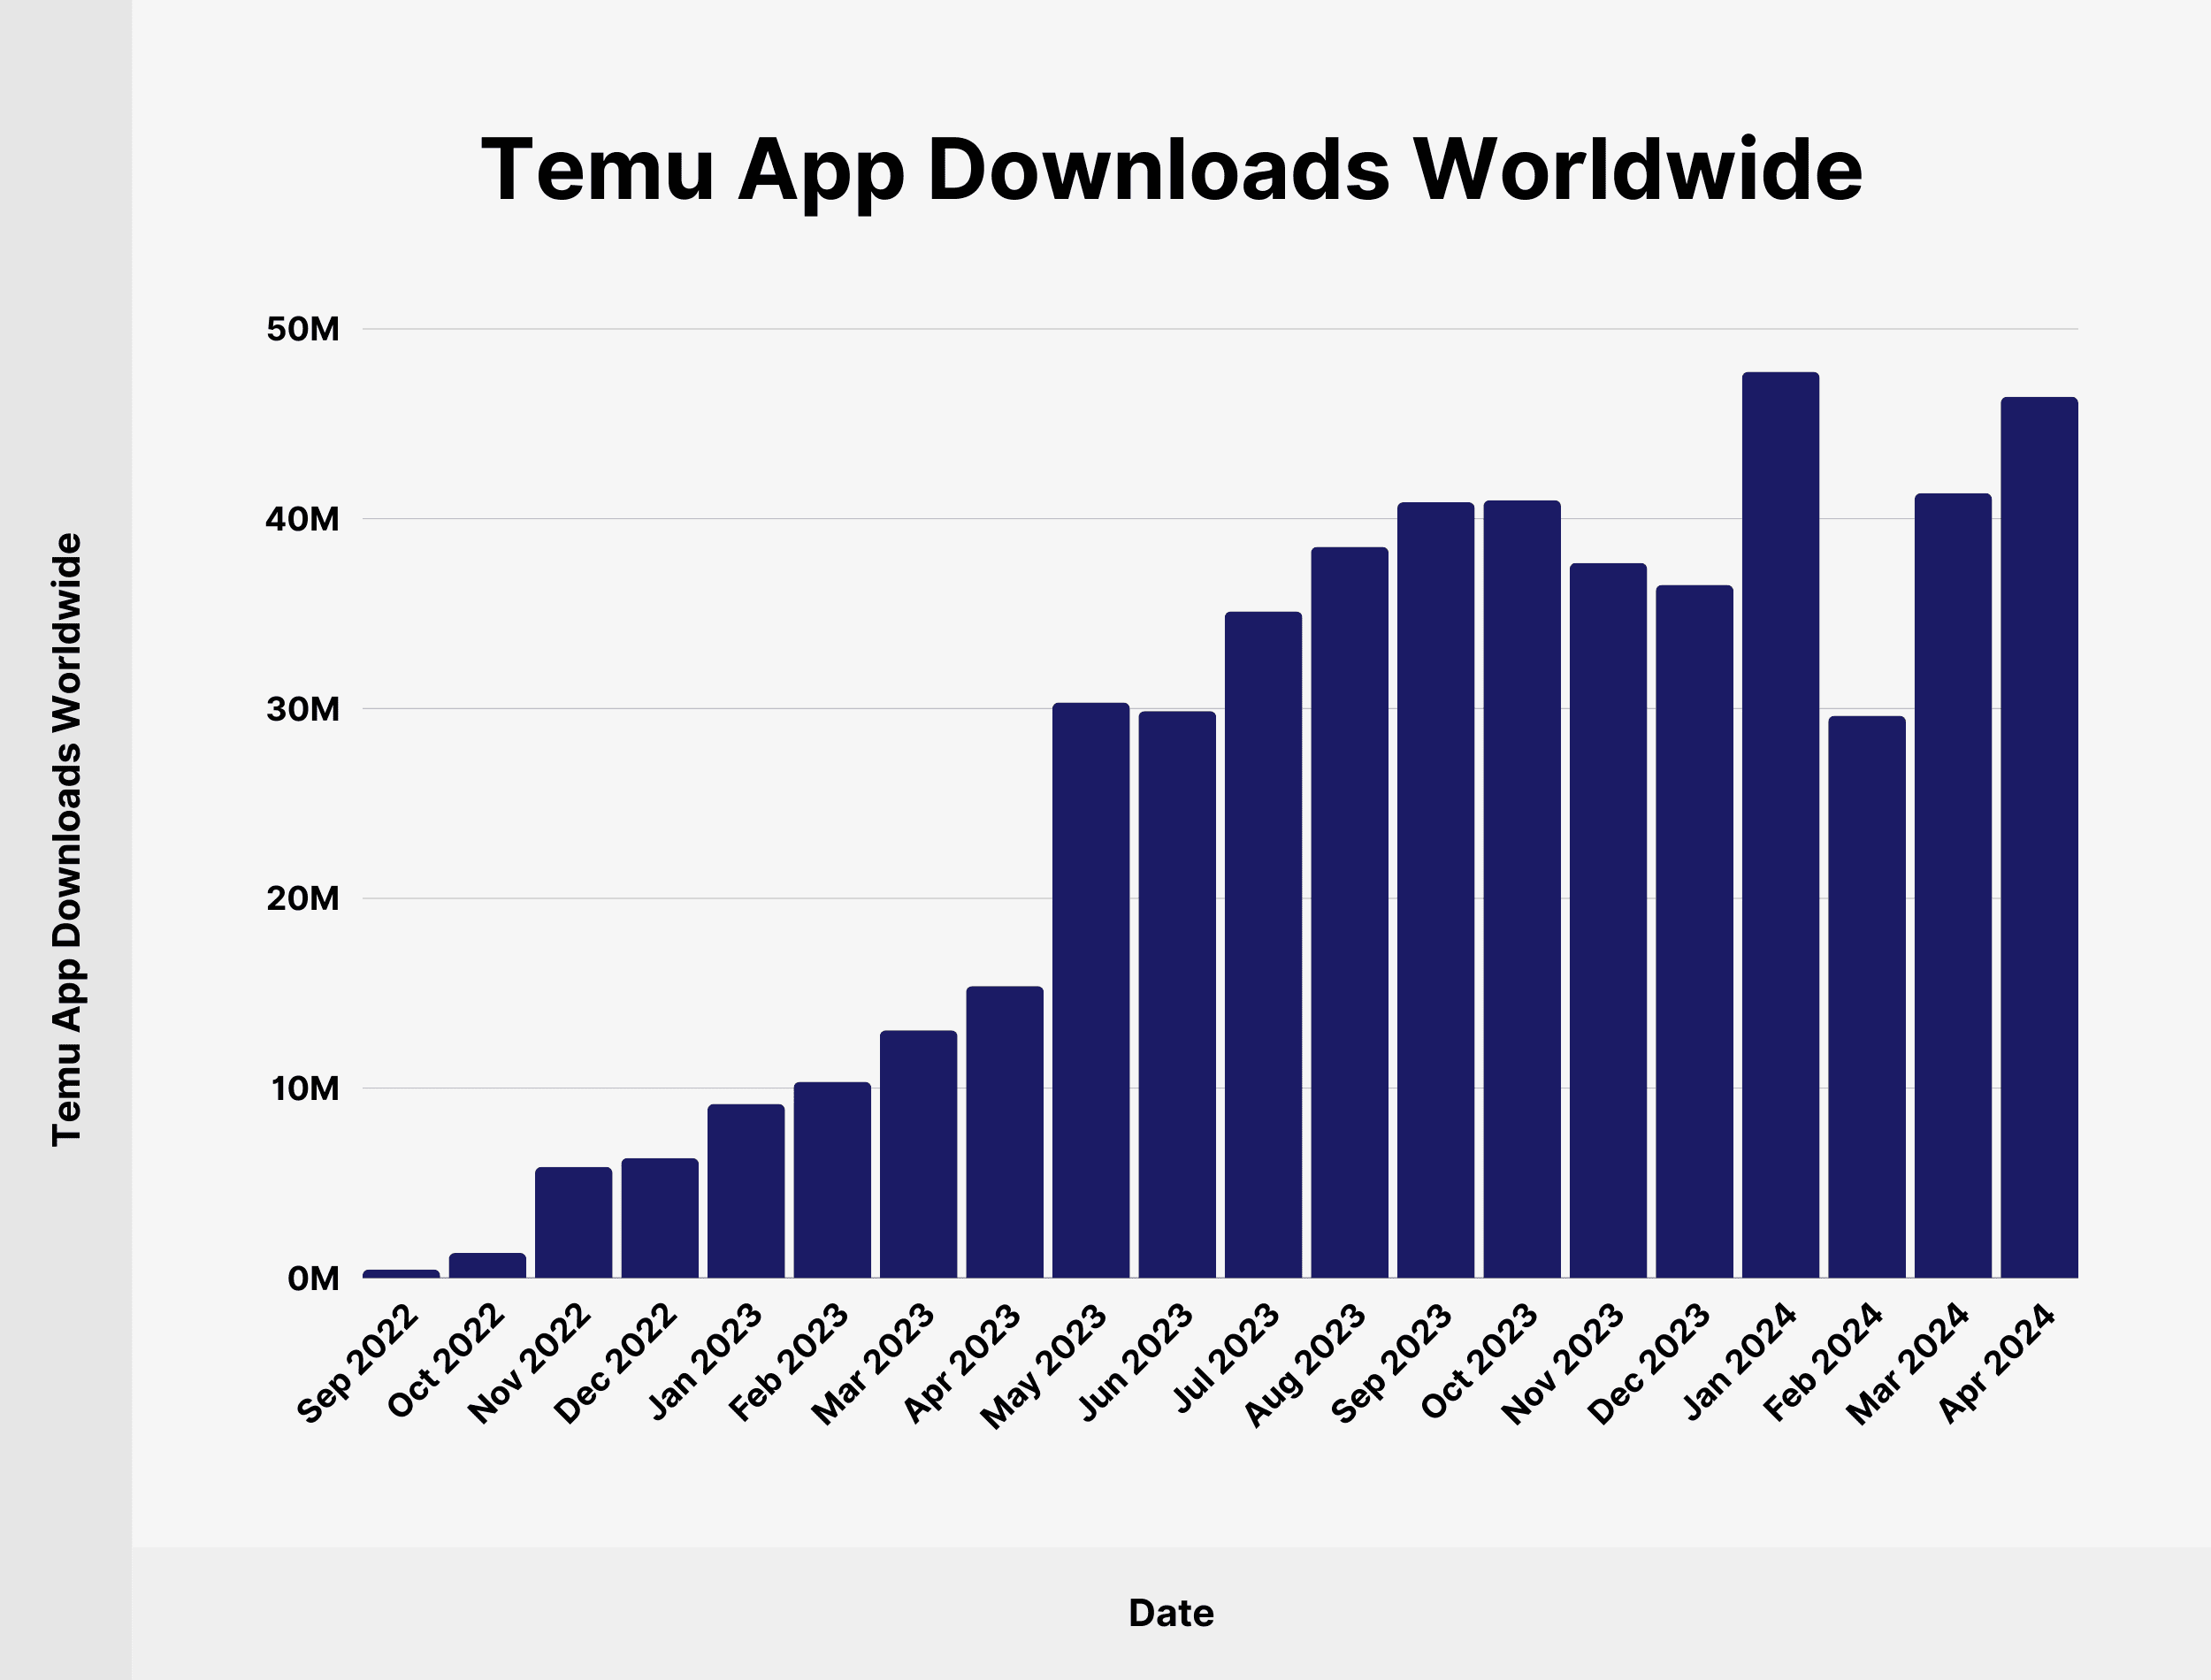
In 2023, Temu downloads reached 337.73 million across the App Store and Google Play worldwide.
Here’s a detailed breakdown of Temu monthly app downloads since September 2022:
| Date | Temu App Downloads Worldwide |
|---|---|
| September 2022 | 0.44 million |
| October 2022 | 1.31 million |
| November 2022 | 5.84 million |
| December 2022 | 6.31 million |
| January 2023 | 9.16 million |
| February 2023 | 10.33 million |
| March 2023 | 13.04 million |
| April 2023 | 15.37 million |
| May 2023 | 30.31 million |
| June 2023 | 29.86 million |
| July 2023 | 35.12 million |
| August 2023 | 38.52 million |
| September 2023 | 40.87 million |
| October 2023 | 40.97 million |
| November 2023 | 37.67 million |
| December 2023 | 36.51 million |
| January 2024 | 47.74 million |
| February 2024 | 29.62 million |
| March 2024 | 41.34 million |
| April 2024 | 46.42 million |
Source: Statista
Average Time Spent with Temu App
In Q2 2023, Temu users spent an average of 18 minutes per day in the mobile app.

To put it in perspective, that’s more daily minutes than on AliExpress (11 minutes), eBay (11 minutes), or Amazon (10 minutes).
Source: Bloomberg
Temu Sales Worldwide
According to recent estimates, ecommerce sales worldwide on Temu reached $15.33 billion in 2023.

Here’s a detailed breakdown of Temu retail sales by quarter over time since Q4 2022:
| Date | Temu Gross Merchandise Value |
|---|---|
| Q4 2022 | $275 million |
| Q1 2023 | $855 million |
| Q2 2023 | $2.7 billion |
| Q3 2023 | $5.16 billion |
| Q4 2023 | $6.62 billion |
Temu is forecasted to bring in $37.13 billion and $50.67 billion in sales in 2024 and 2025, respectively.
Source: AllianceBernstein
Temu Order Volume Worldwide
According to recent data, consumers placed a total of 412.3 million orders on Temu in 2023.
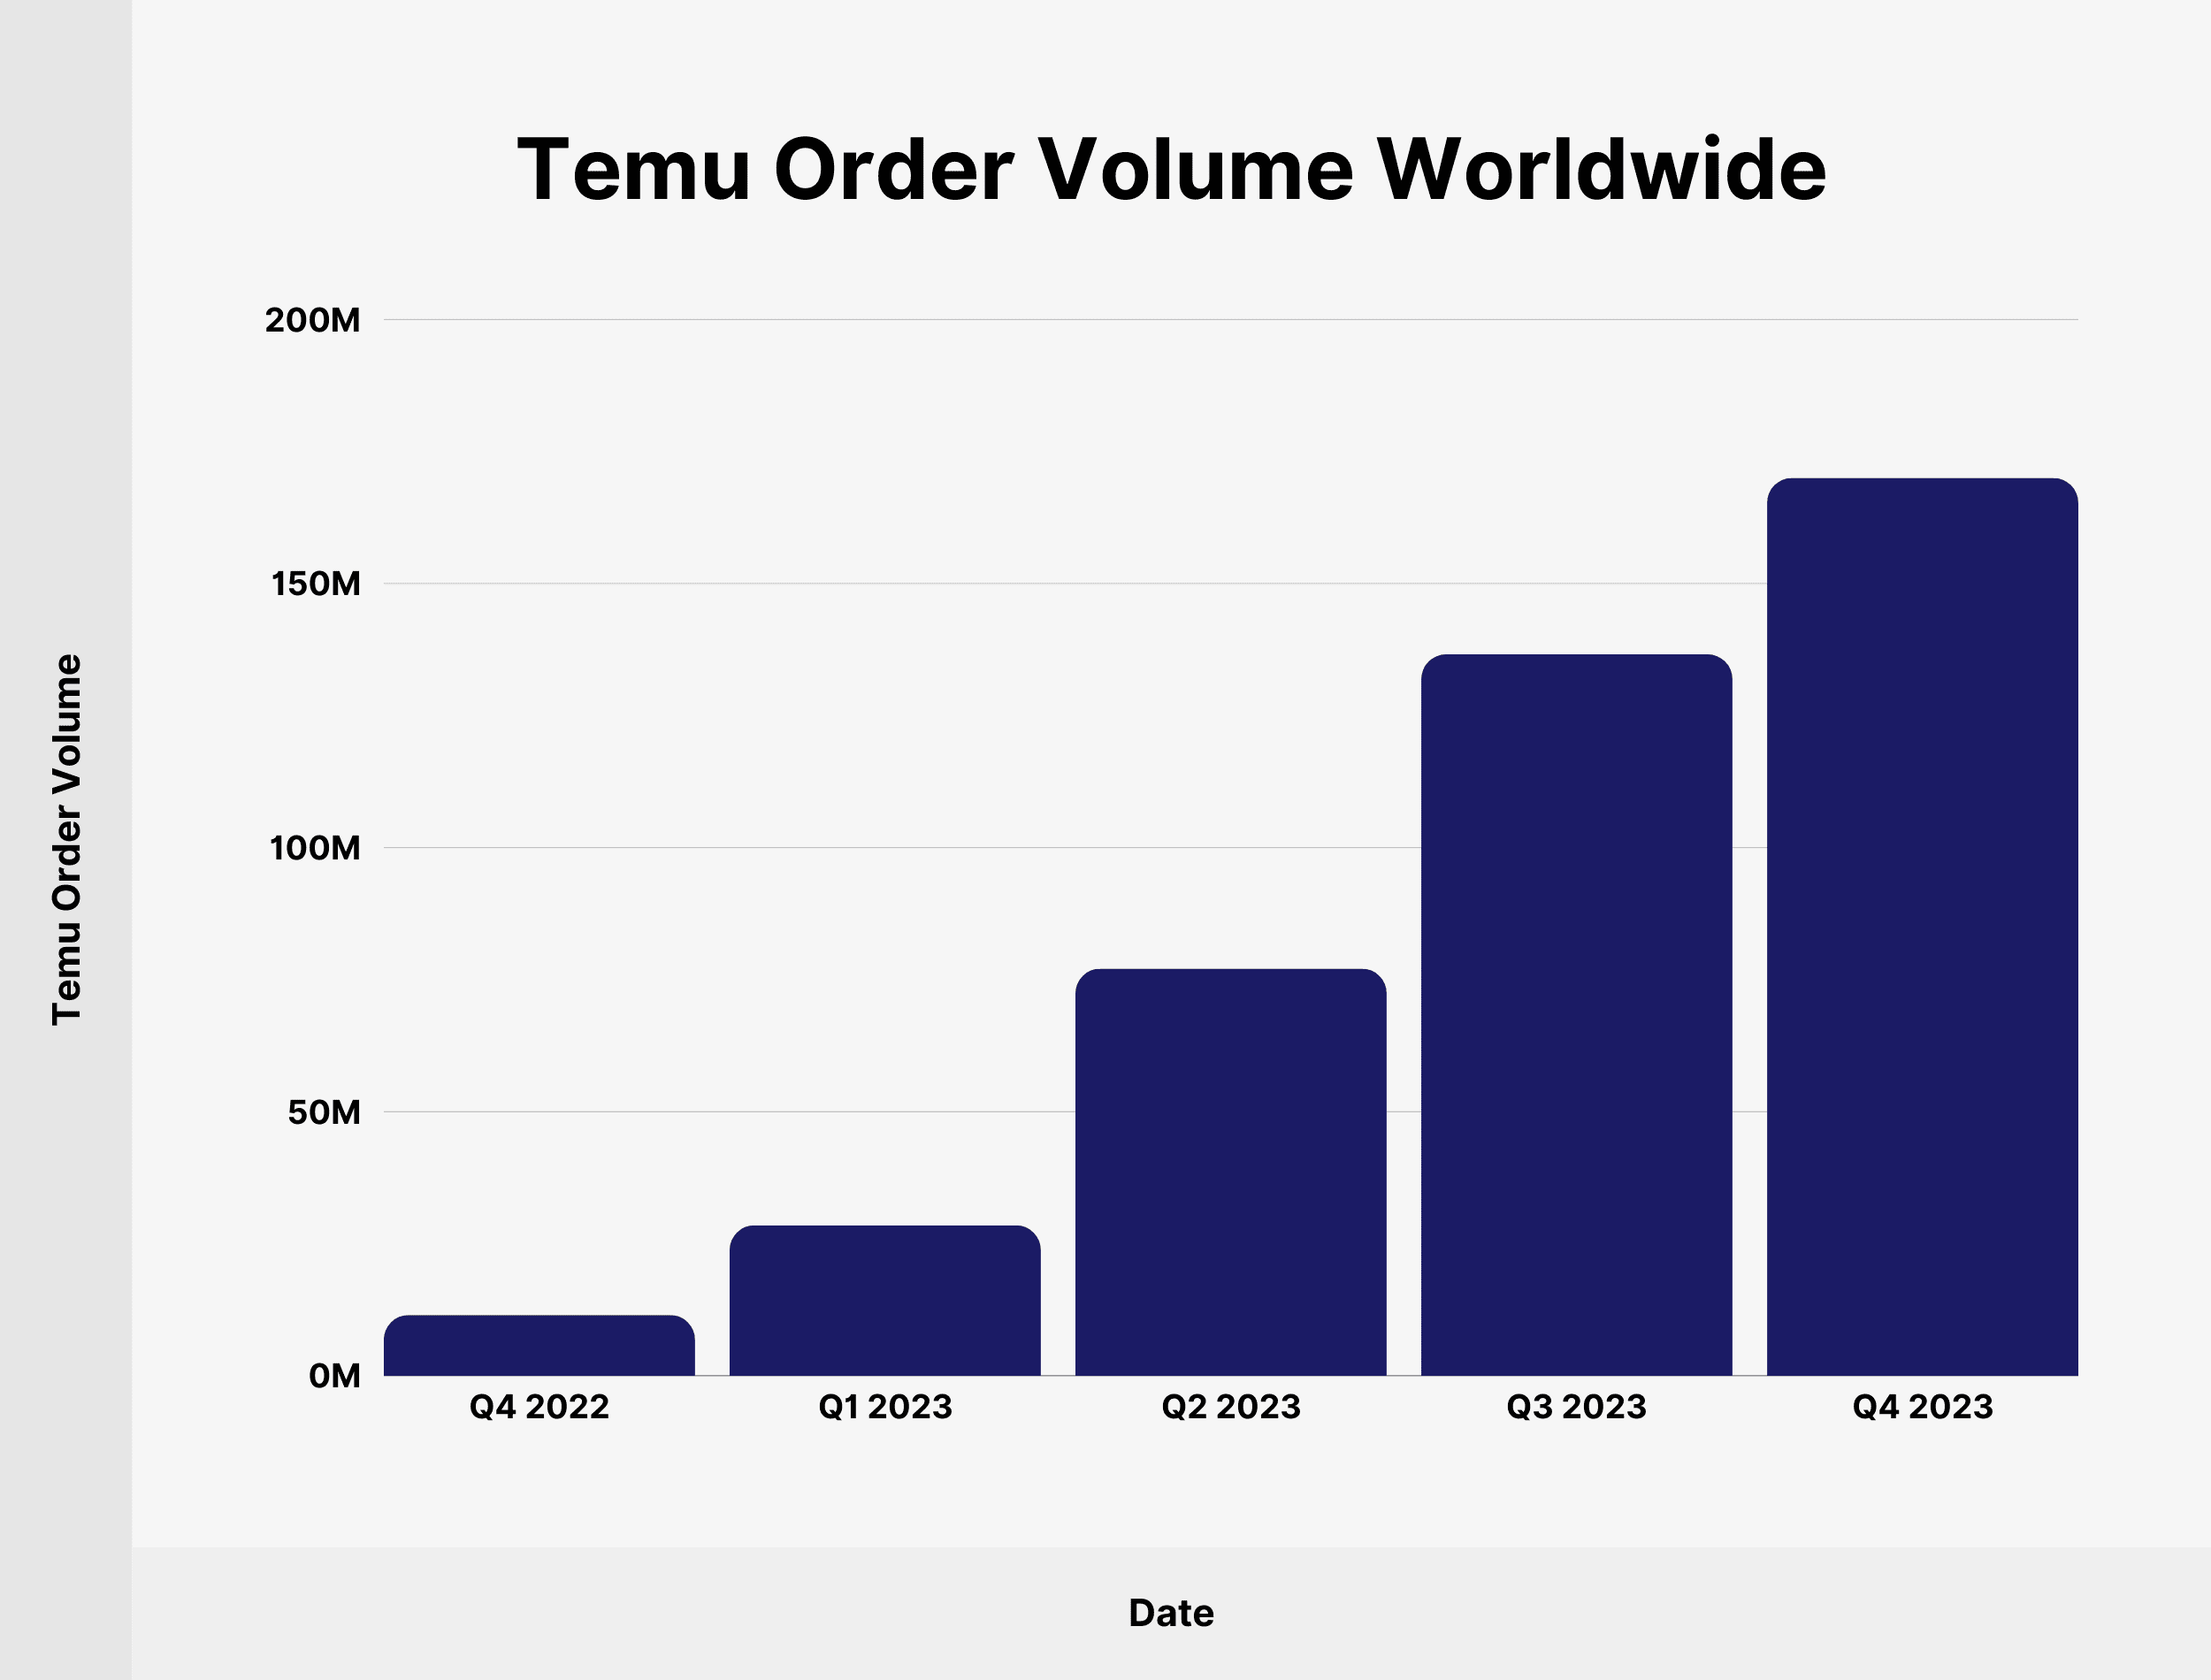
In Q4 2023 alone, the number of orders on Temu reached 170 million, a 14.8x increase compared to 11.5 million in Q4 2022.
Here’s a table with the number of orders on Temu since Q4 2022:
| Date | Temu Order Volume |
|---|---|
| Q4 2022 | 11.5 million |
| Q1 2023 | 28.5 million |
| Q2 2023 | 77.1 million |
| Q3 2023 | 136.6 million |
| Q4 2023 | 170.0 million |
Source: AllianceBernstein
Temu Average Order Value
Average order value on Temu reached $38.9 in Q4 2023, representing a 62.08% year-over-year increase.
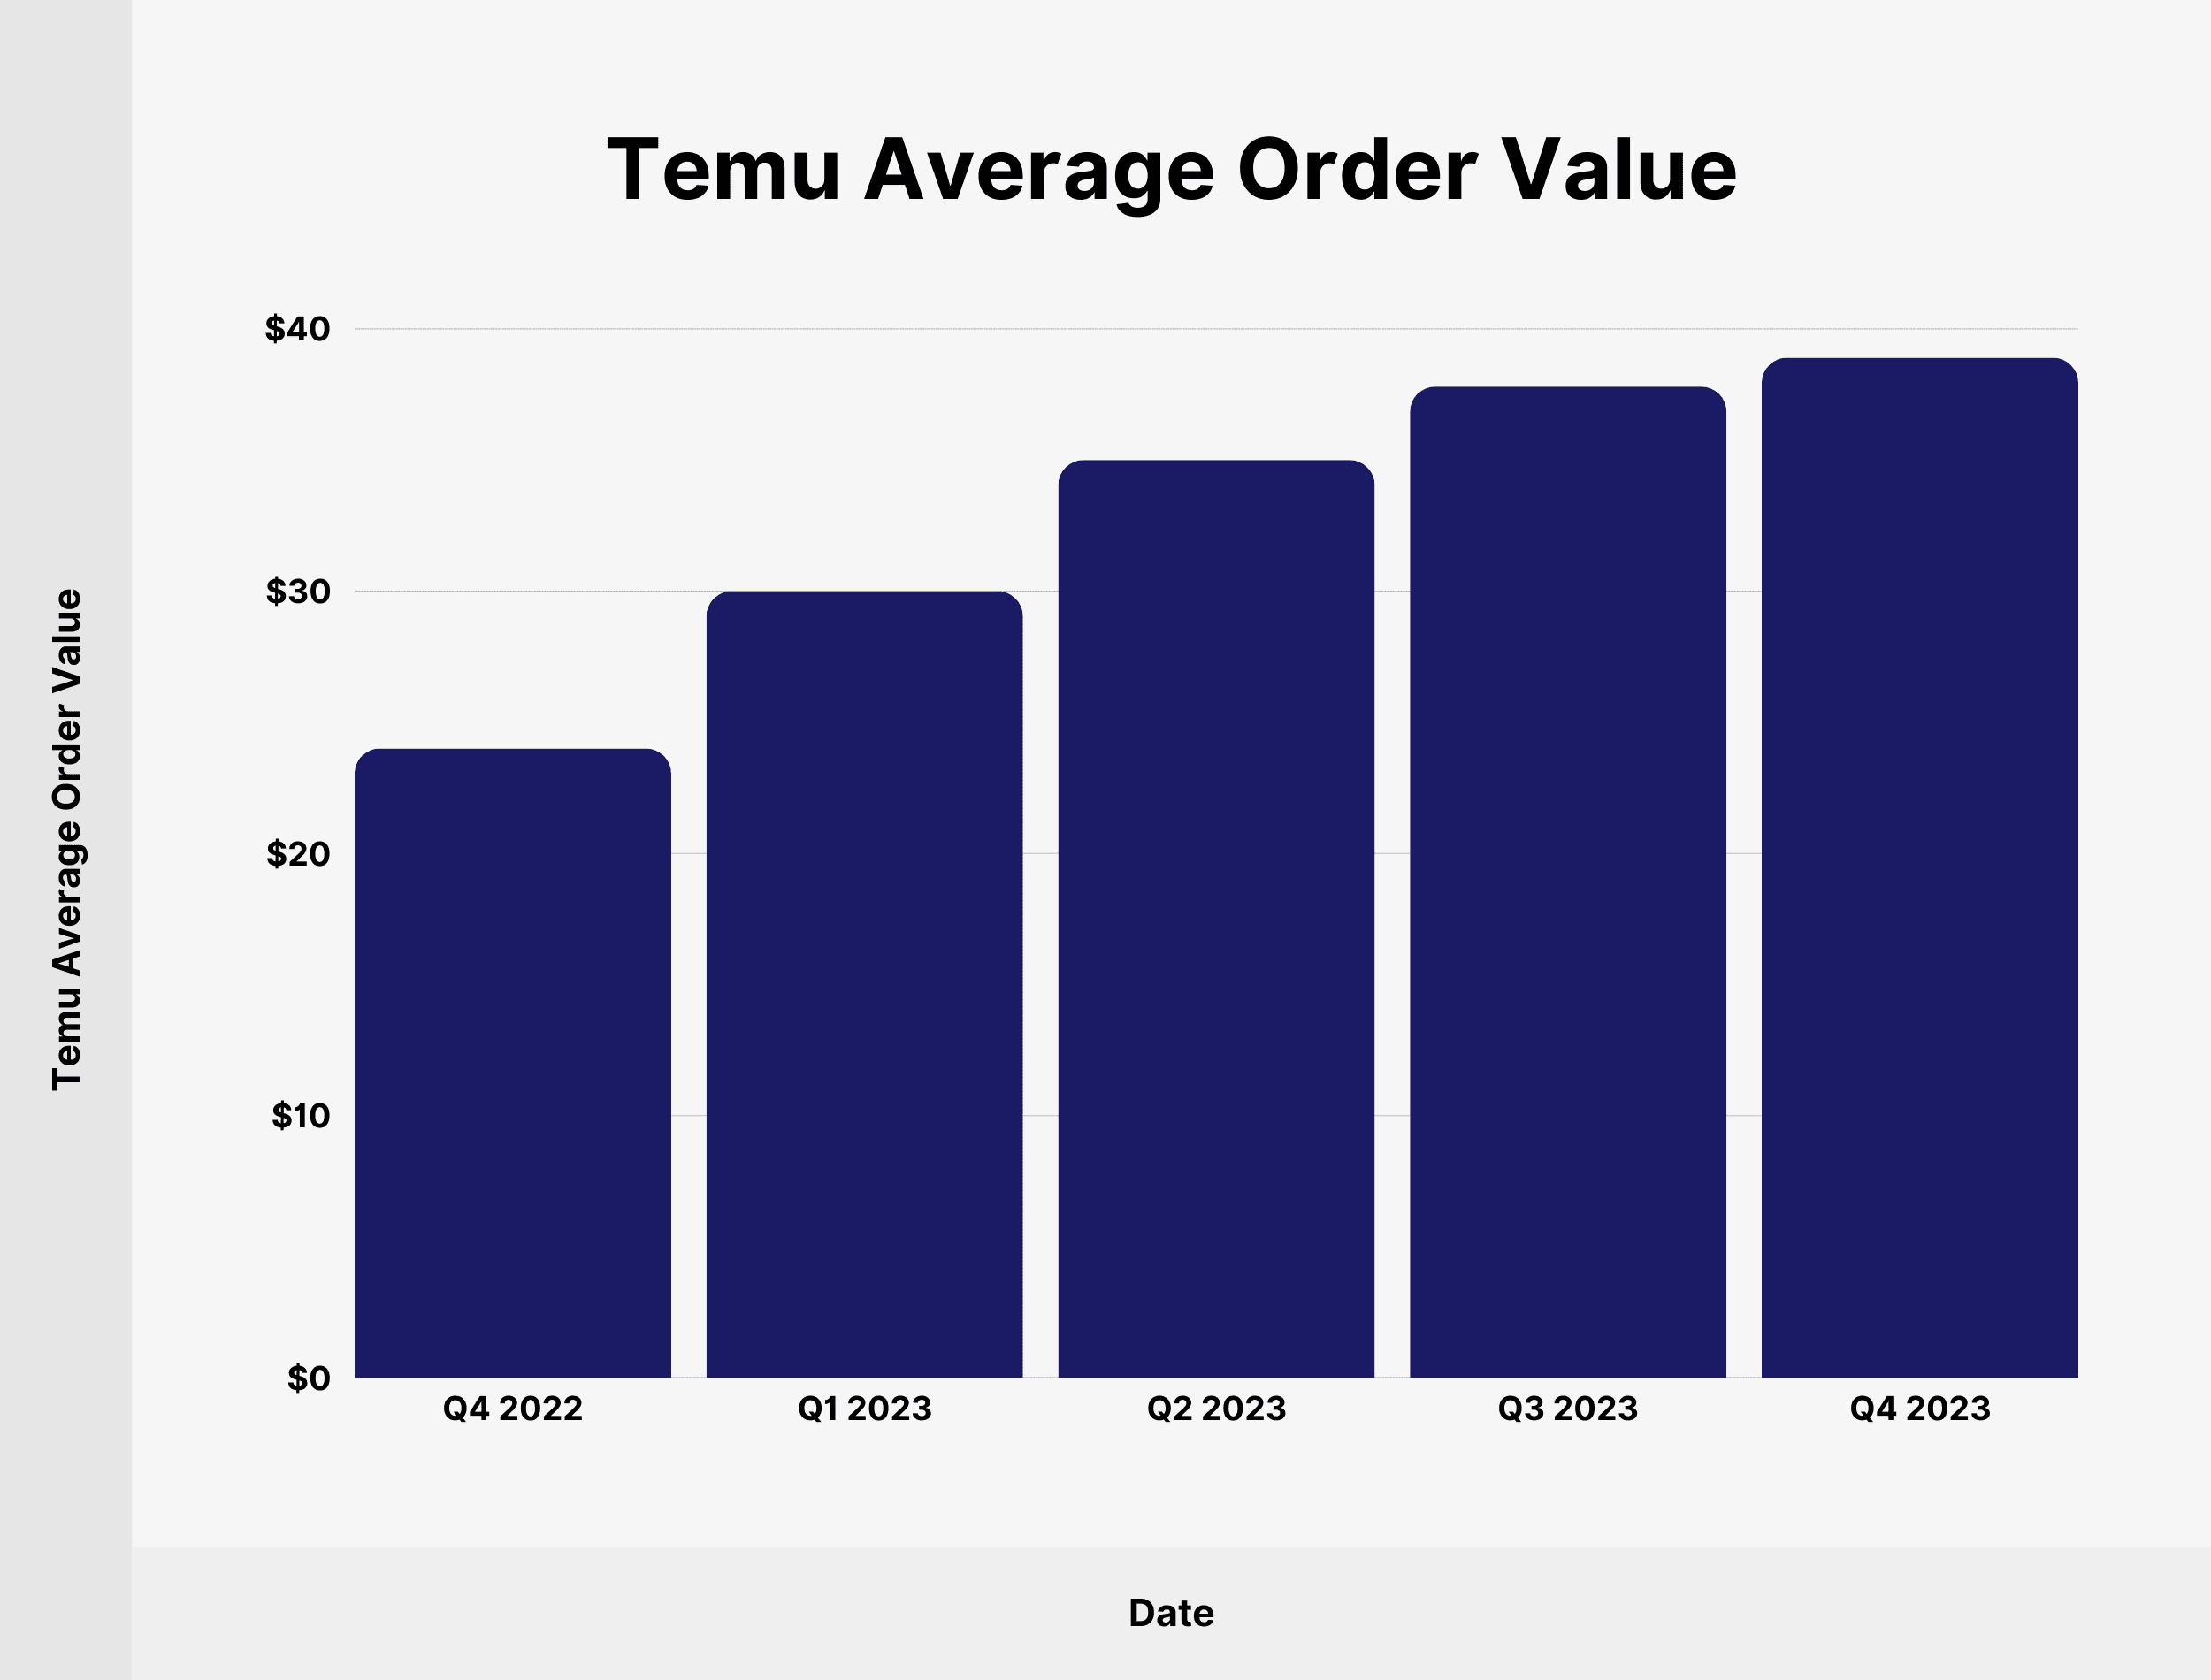
Here’s a table with the average order value since Q4 2022:
| Date | Temu Average Order Value |
|---|---|
| Q4 2022 | $24.0 |
| Q1 2023 | $30.0 |
| Q2 2023 | $35.0 |
| Q3 2023 | $37.8 |
| Q4 2023 | $38.9 |
Source: AllianceBernstein
Temu Monthly Visits Worldwide
In May 2024, the number of monthly visits to the Temu website reached 531.16 million. That’s up from 420.99 million monthly visits in December 2023.
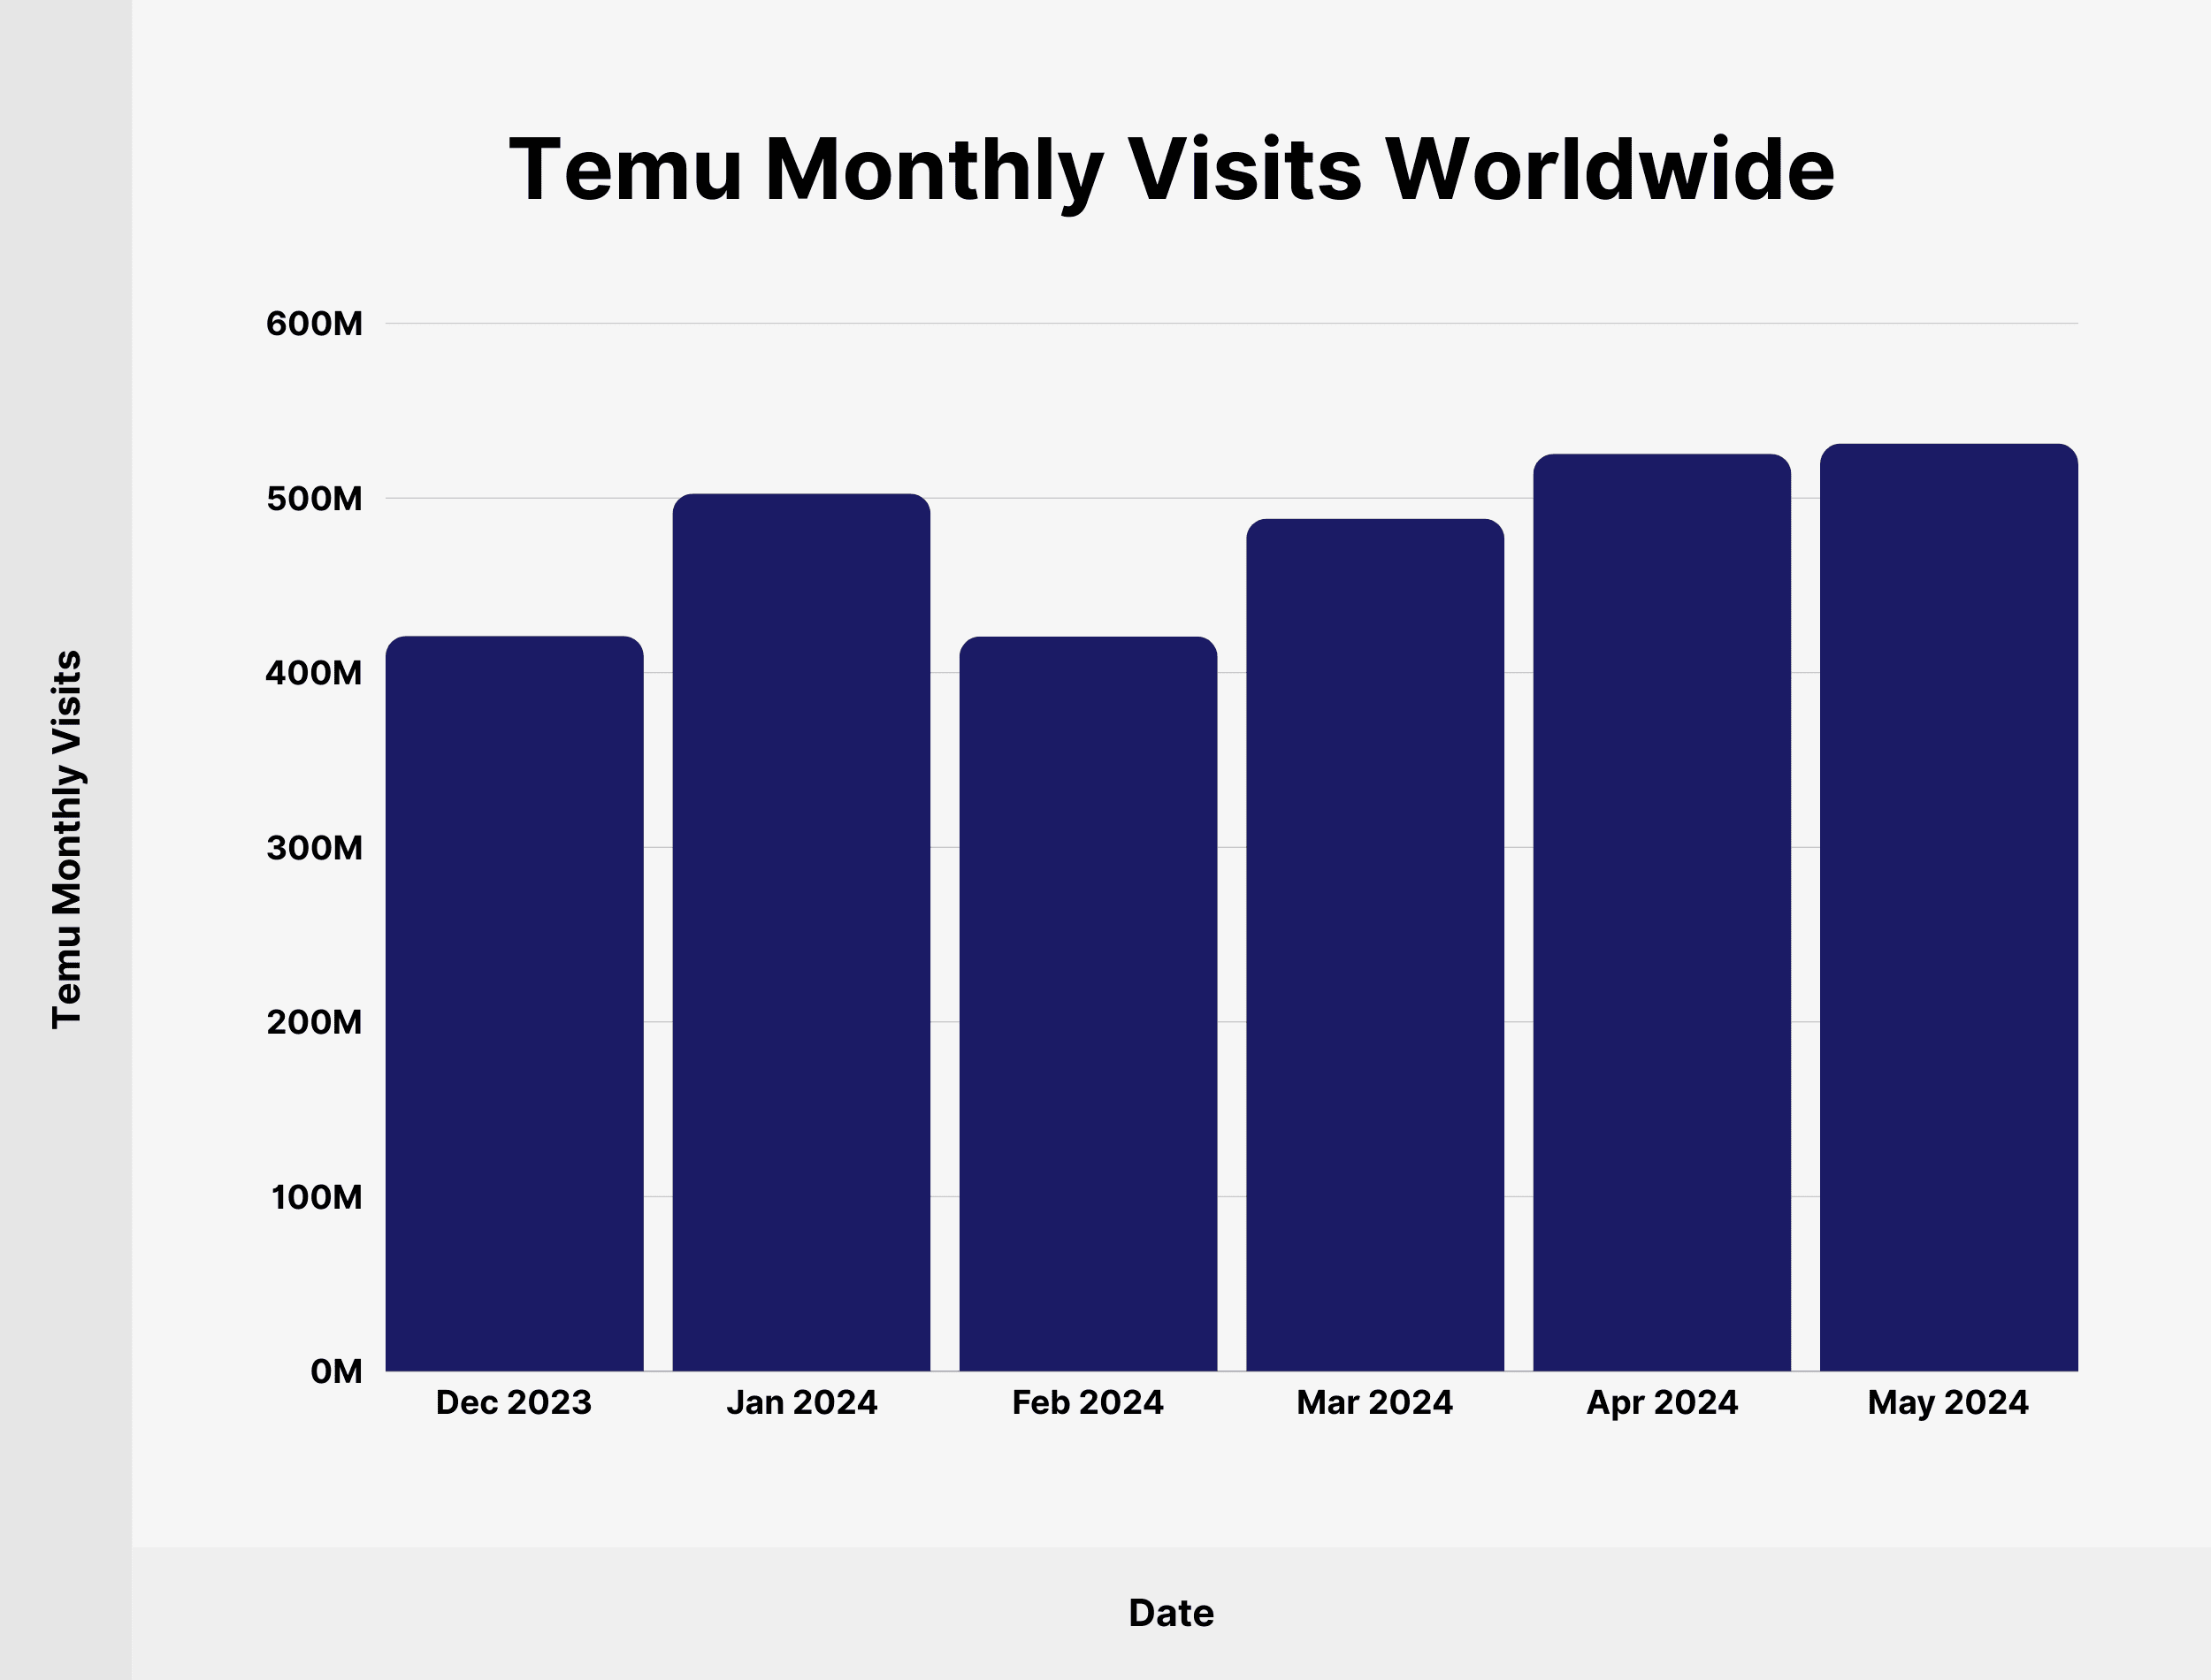
Here’s a detailed breakdown of desktop and mobile visits to the Temu website since December 2022:
| Date | Temu Monthly Visits |
|---|---|
| December 2023 | 420.99 million |
| January 2024 | 502.47 million |
| February 2024 | 420.69 million |
| March 2024 | 488.2 million |
| April 2024 | 525.26 million |
| May 2024 | 531.16 million |
The number of unique visitors to the Temu website reached 213.2 million in May 2024.
Source: Semrush
Temu Brand Awareness in the US
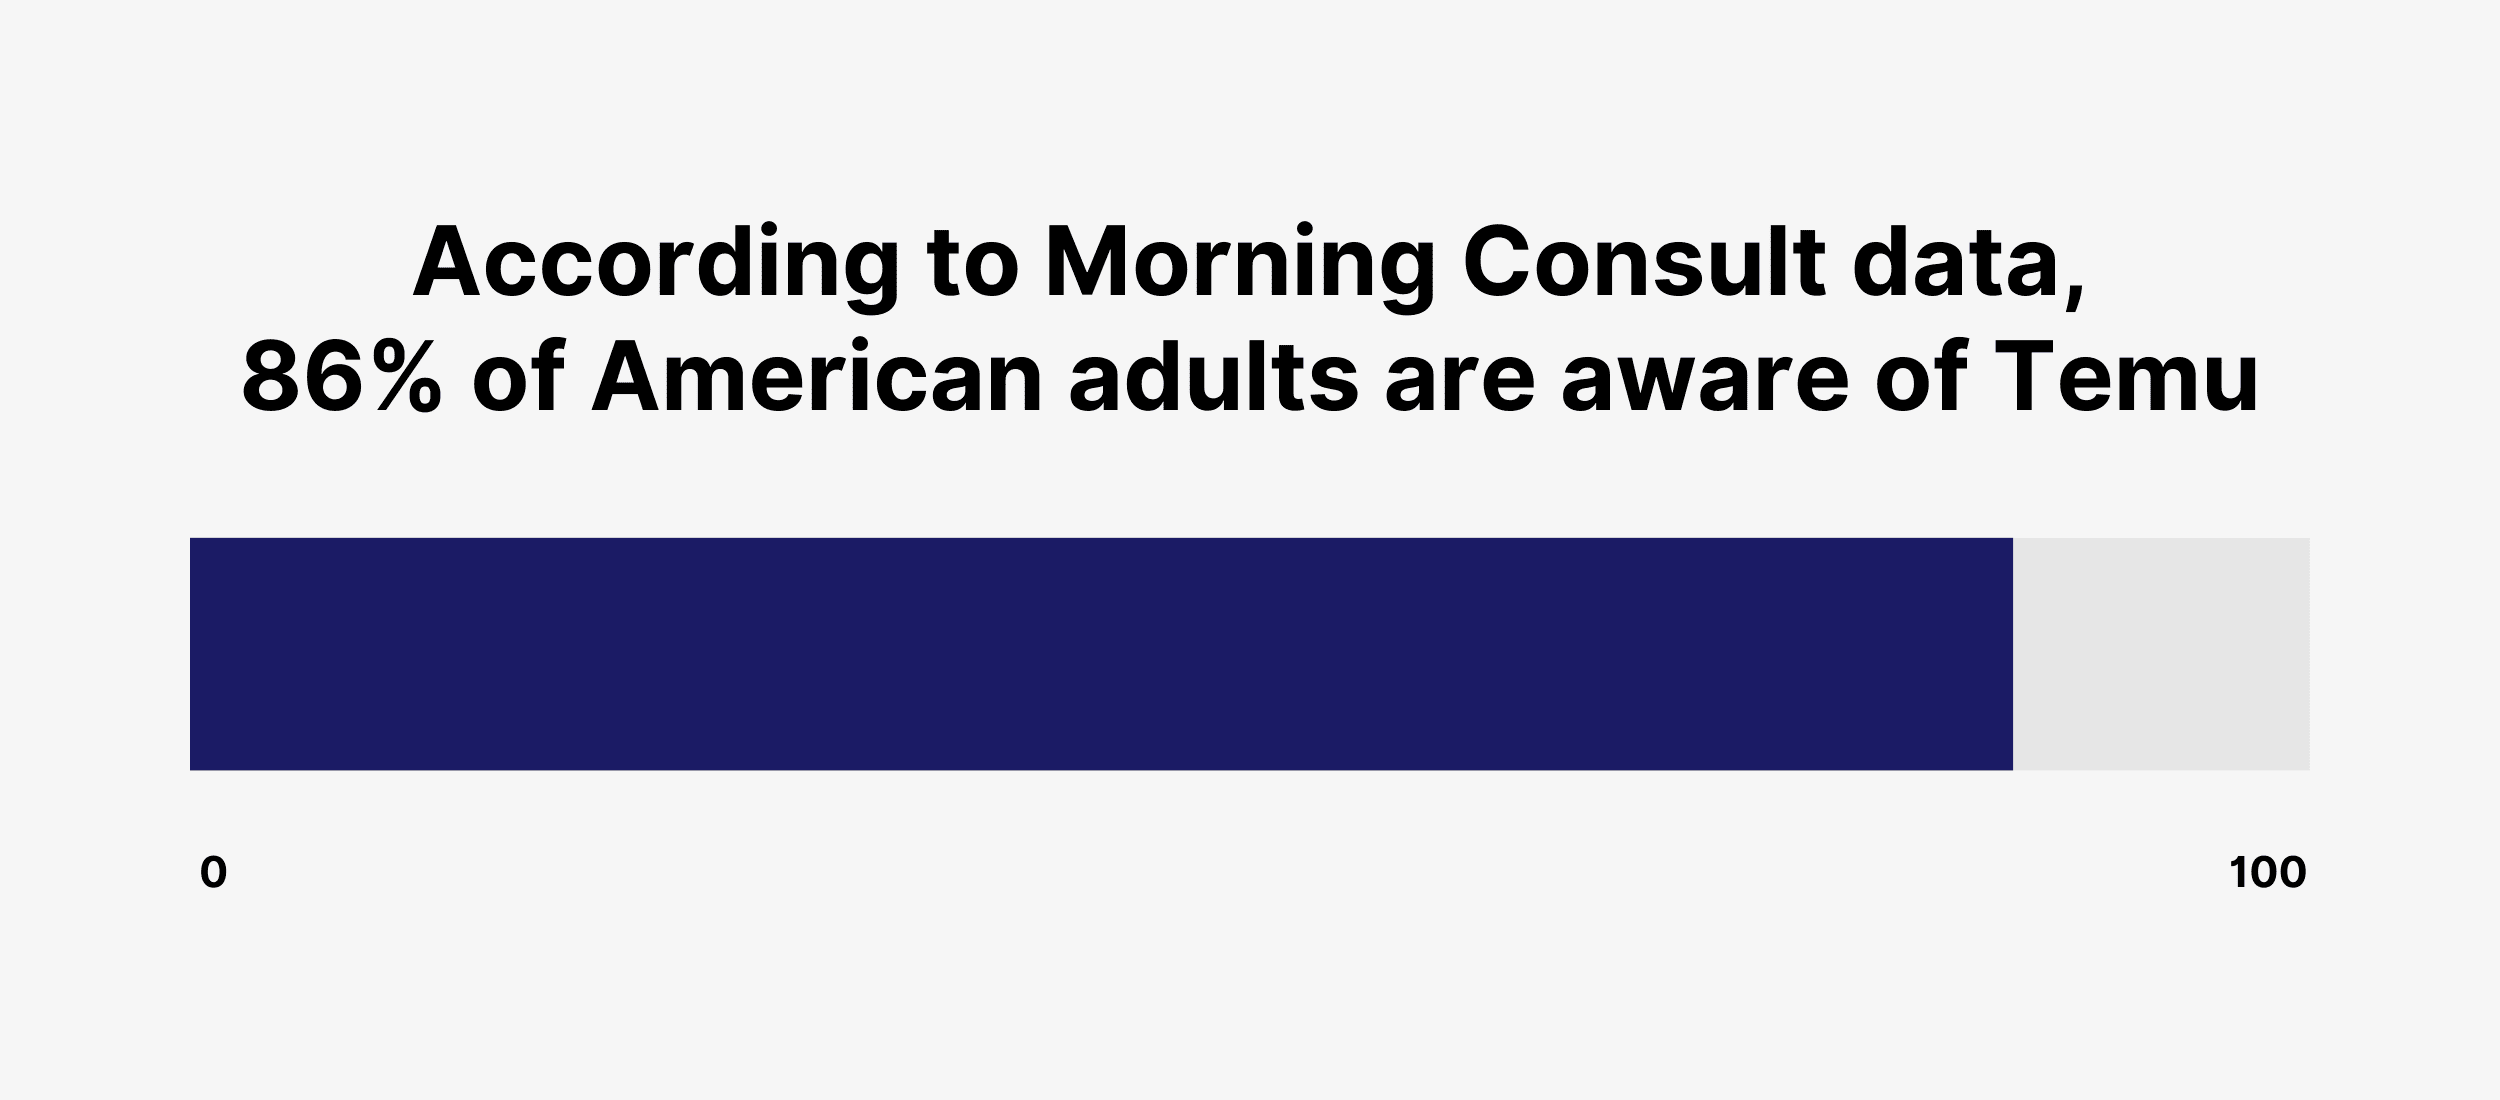
According to Morning Consult data, 86% of American adults are aware of Temu as of March 2024. That’s up from 75% in September 2023.
4 in 10 US adults claim to have made a purchase on Temu.
Source: Morning Consult
Temu Adoption Rate
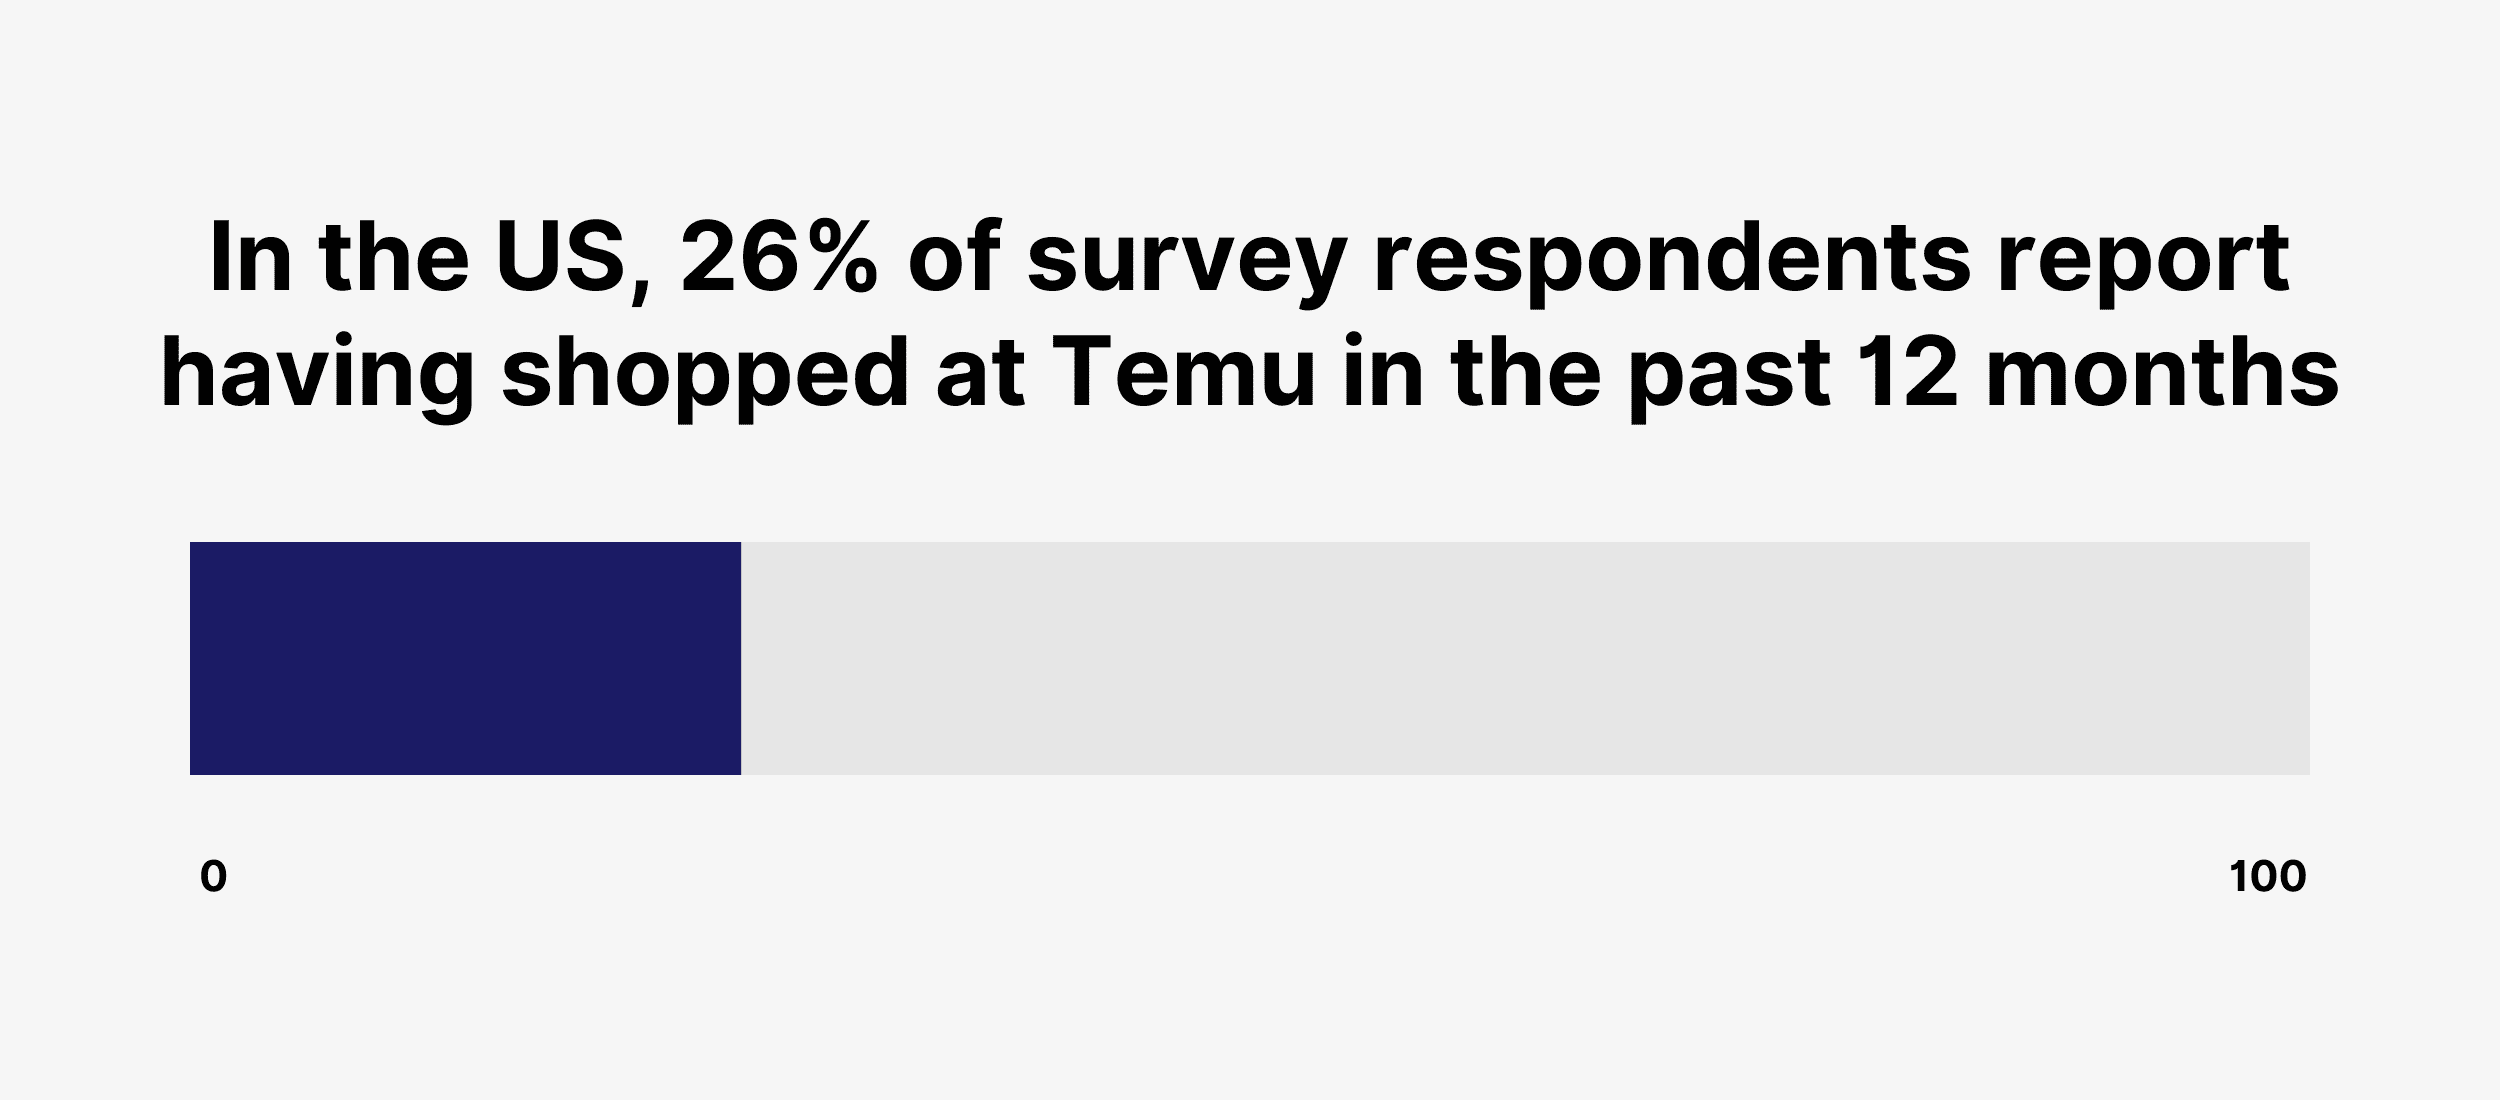
In the US, 26% of survey respondents report having shopped at Temu in the past 12 months. That’s similar to H&M (26%) and Shein (24%) adoption rate.
In the UK, 12% of consumers claim to have made a purchase at Temu in the last 12 months.
Among UK and US shoppers, Temu is most popular among millennials (ages 25-42) with a 21% adoption rate, followed by Gen X (43-55) with a 20% rate.
| Generation | Share of US and UK Consumers Who Shopped at Temu |
|---|---|
| Gen Z (18-24) | 14% |
| Millennials (25-42) | 21% |
| Gen X (43-55) | 20% |
| Boomers (56+) | 17% |
Source: Business of Fashion
Temu Market Share in the US
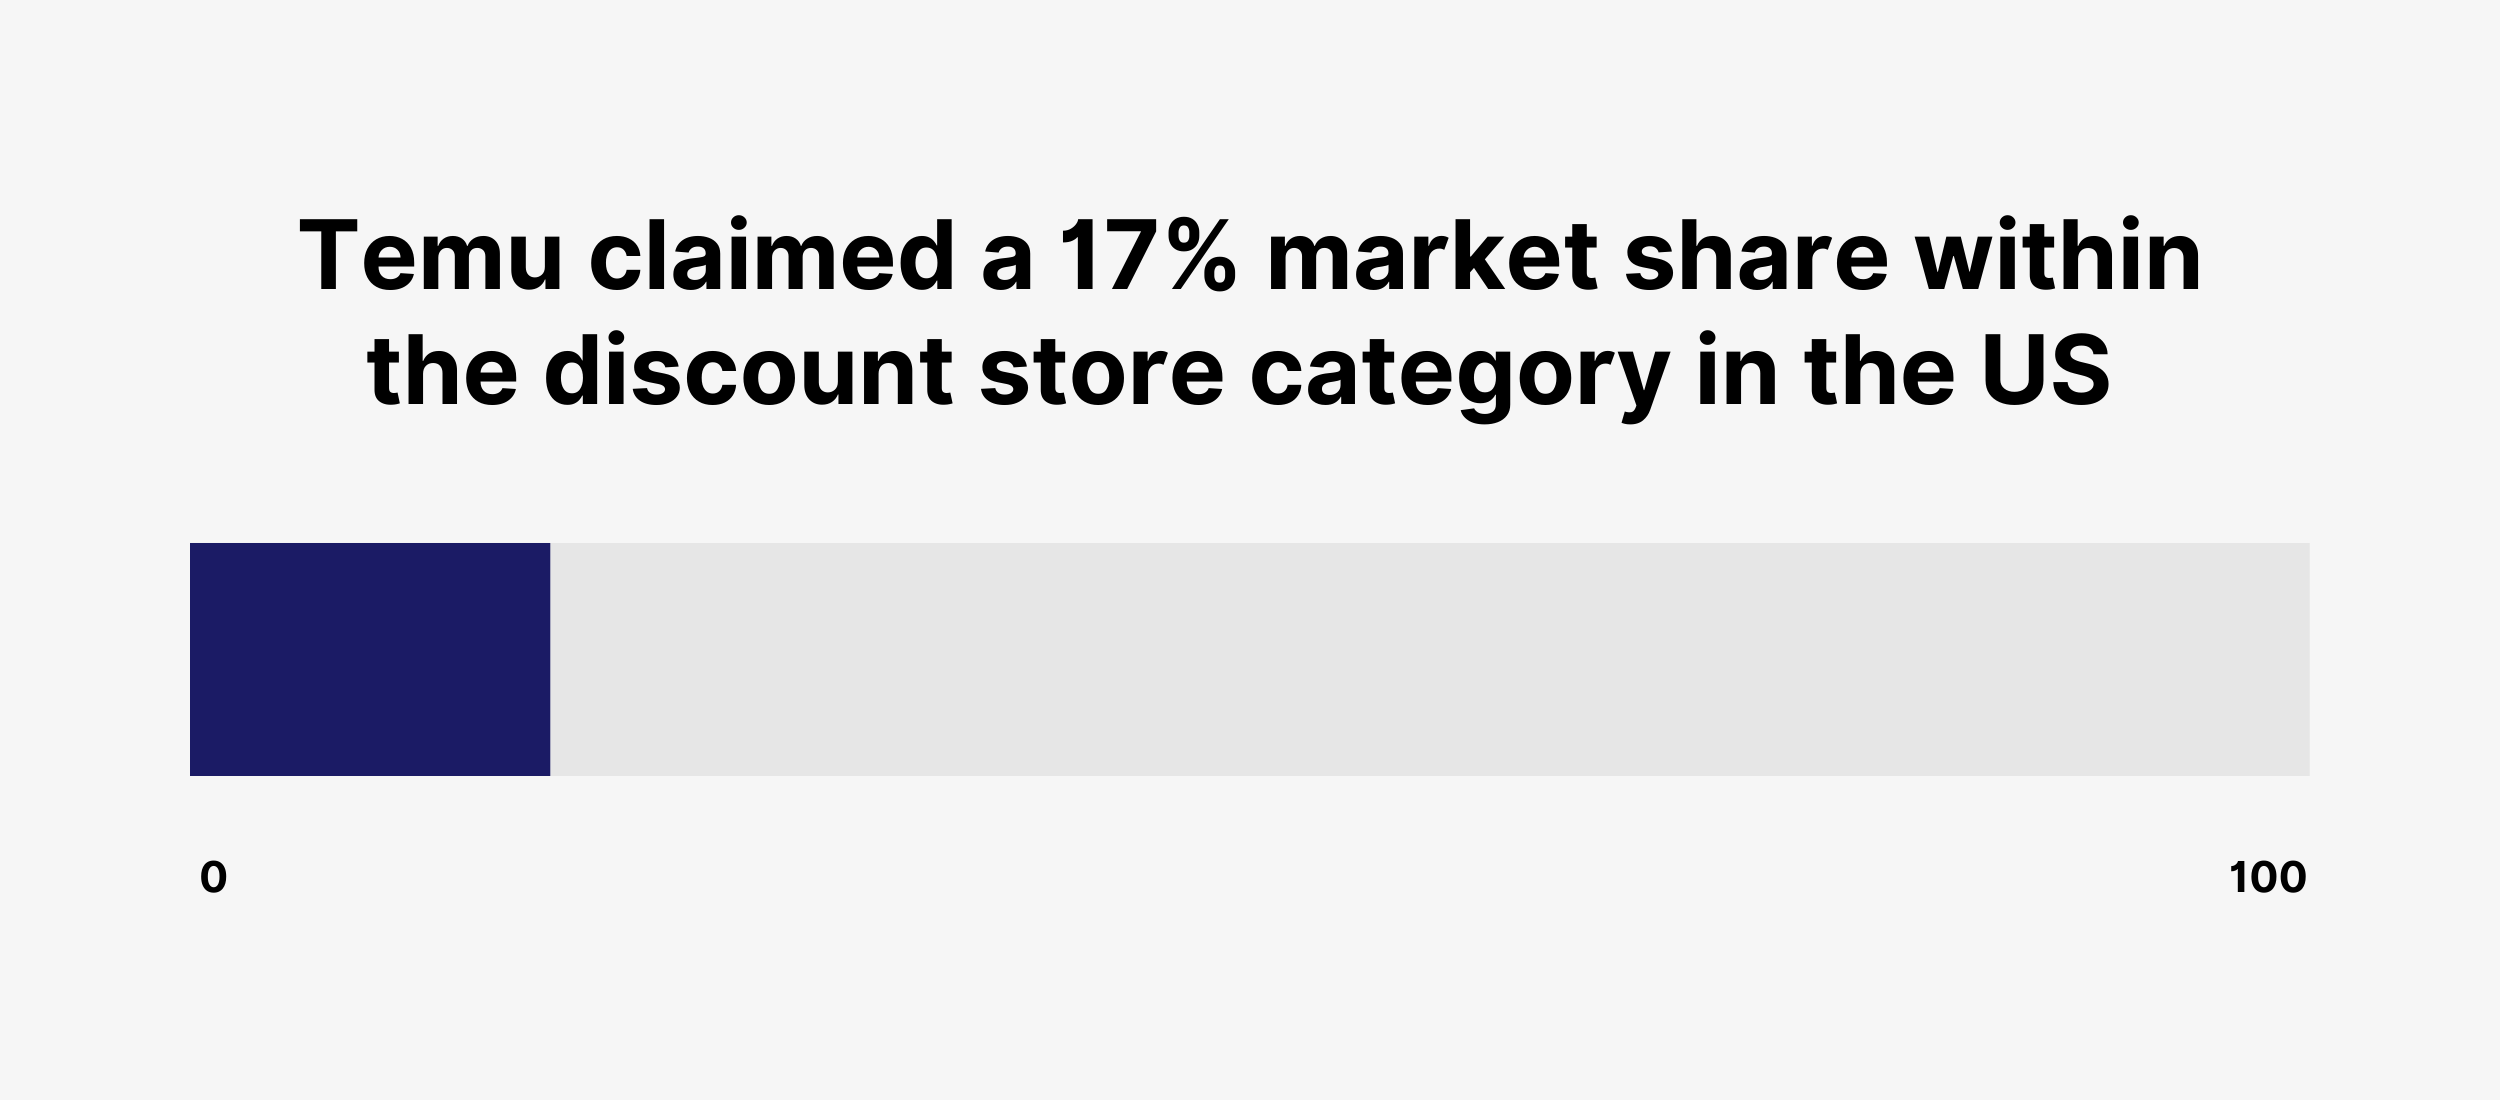
Temu claimed a 17% market share within the discount store category in the US in November 2023, behind Dollar General (43%) and Dollar Tree (28%).
Source: Business of Fashion
Temu Customers Overlap with Other Retailers
According to Earnest Analytics data, more than 8 in 10 US Temu customers shop at Walmart, Amazon, and Target.

Here’s a detailed breakdown of Temu customers overlap in the US with other retailers:
| Retailer | Percentage of Temu’s Customers in the US |
|---|---|
| Walmart | 97% |
| Amazon | 96% |
| Target | 84% |
| Dollar Tree | 71% |
| Dollar General | 59% |
| Etsy | 49% |
| Sam’s Club | 47% |
| Five Below | 44% |
| Costco | 42% |
| eBay | 35% |
| Family Dollar | 33% |
| TikTok Shop | 25% |
| Big Lots | 23% |
| Ollie’s Bargain Outlet | 14% |
| PopShelf | 8% |
| Meijer | 7% |
| BJ’s | 7% |
| AliExpress | 5% |
Source: Earnest Analytics
Conclusion
That’s it for my list of Temu stats in 2024.
It’s incredible that Temu grew so fast in a short time frame, and now poses a threat to ecommerce giants like Amazon. It will be interesting to see whether that type of growth is sustainable.
Content Copyrights Belong to The Author. All Rights Reserved.
We're A Dallas Digital Marketing Agency That is Experts At Social Media Marketing, Website Design and Emarketing and Promotion.

